Note: Custom Reports are available as a part of Common Assessments add-on. To access this feature and learn more about Common Assessments add-on and the Schools & Districts plan, please email sales@wayground.com
-
Use a Multi-Assessment Analysis report to compare student performance across two or more Wayground or external assessments in one place. It helps you find patterns that repeat across assessments, spot changes that warrant a closer look, and identify students who may benefit from support or extension.
Start with the question you want to answer -
How does performance shift across the selected assessments?
How can I see performance trends across schools, classes, subgroups?
Which students show consistent performance, improvement, or fluctuation?
How can I look at Item Analysis for one of the assessments?
How can I focus every report view on one population?
Access the report
Go to Sessions → Custom Reports
Select the “Multi-Assessment Analysis” report you want to review
Begin on the Summary view to see the broadest patterns across assessments.
How does performance shift across the selected assessments?
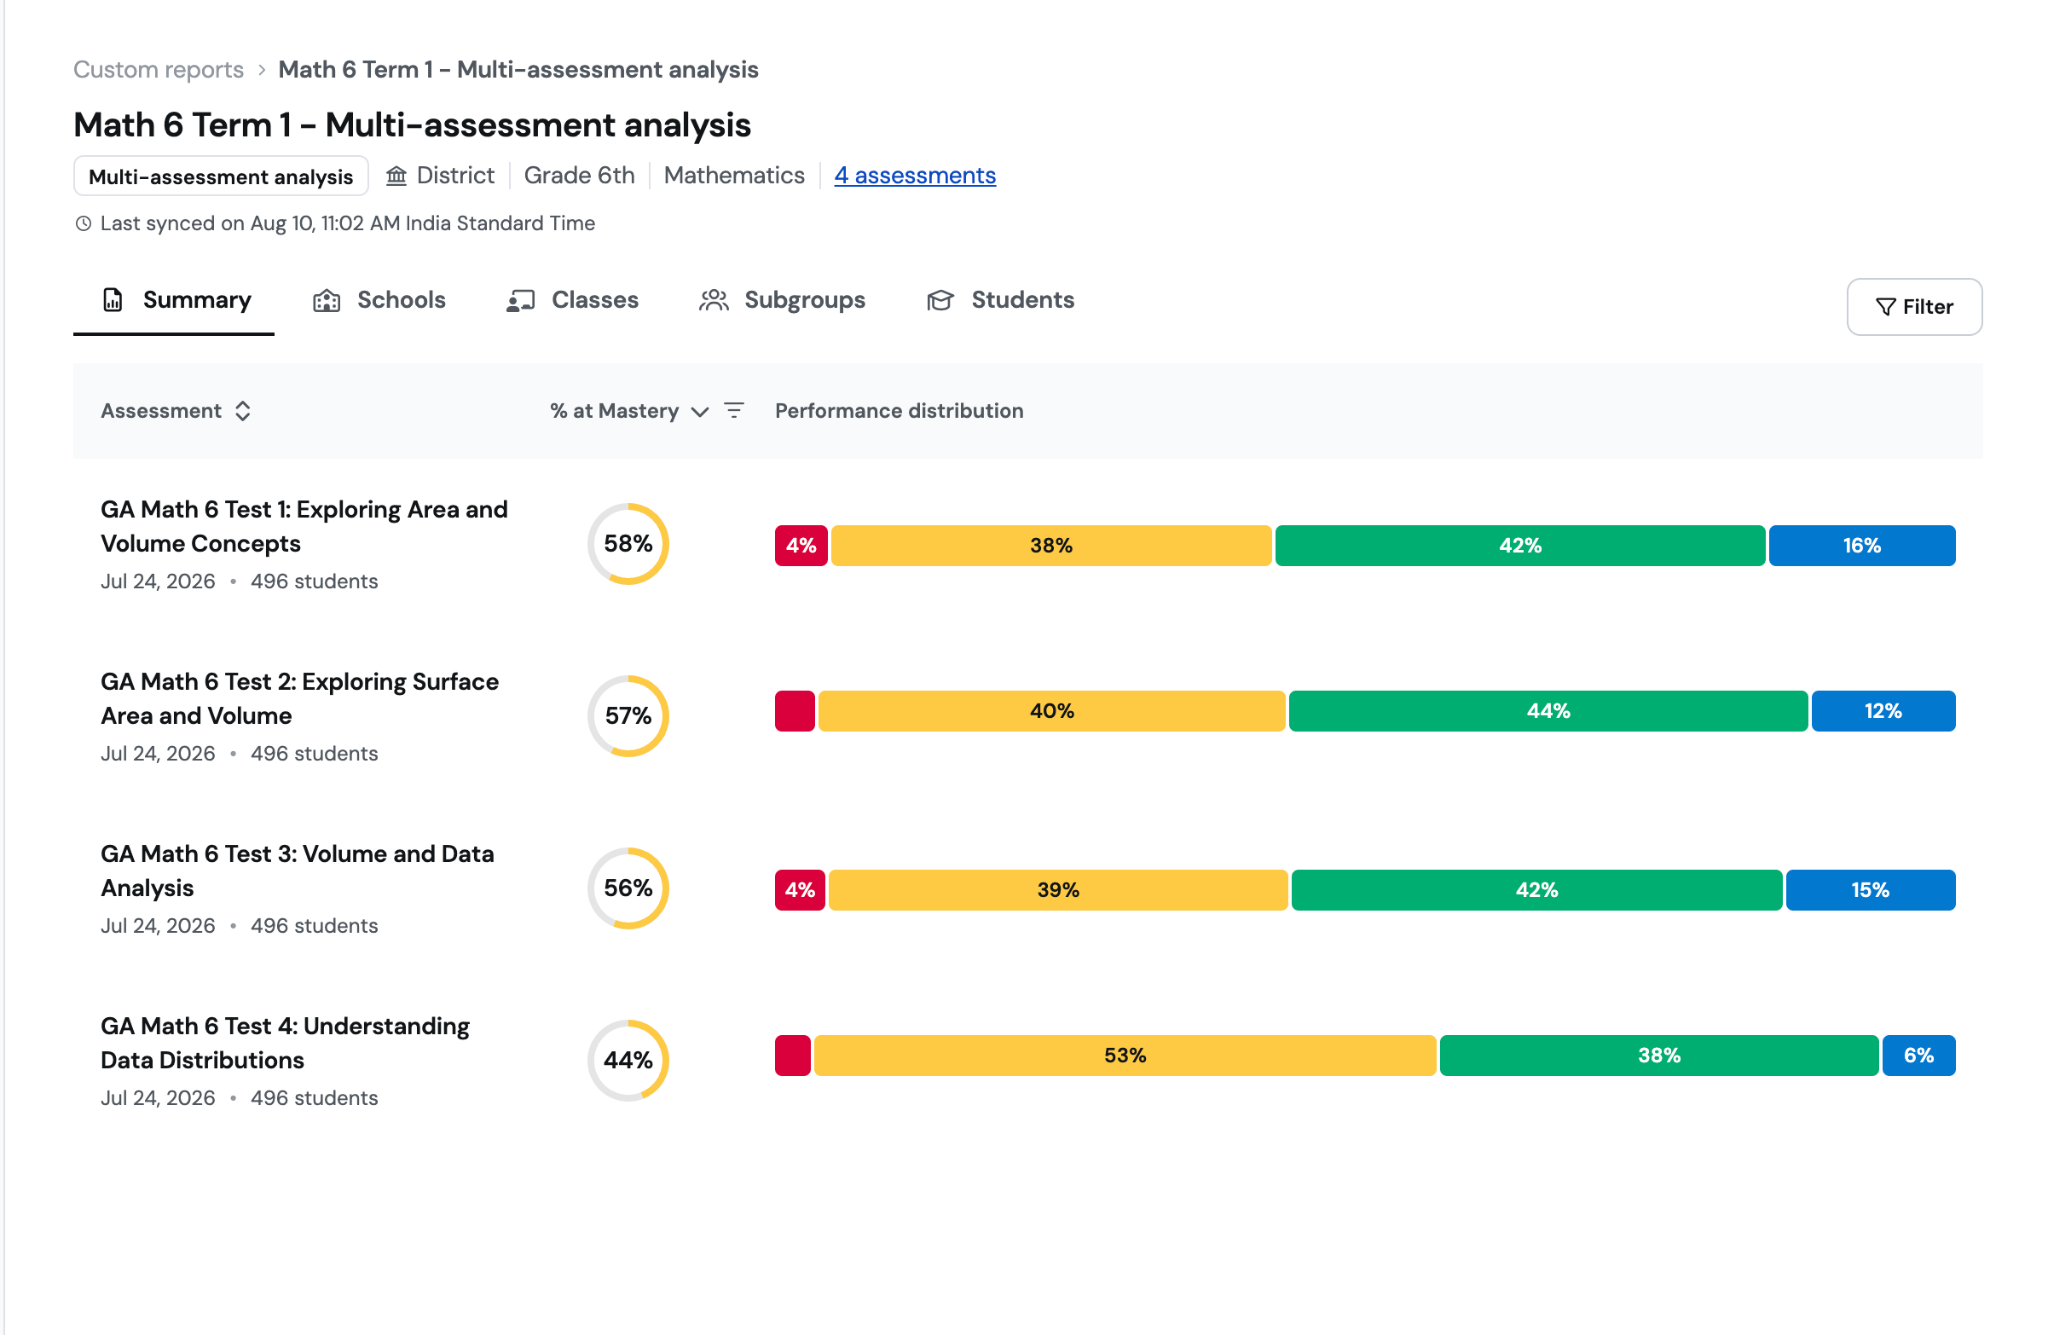
Use the Summary view to compare the selected assessments side by side. Each assessment keeps its own performance bands. Because assessments can differ in scale, difficulty, rigor, and timing.
How can I see performance trends across schools, classes, subgroups?
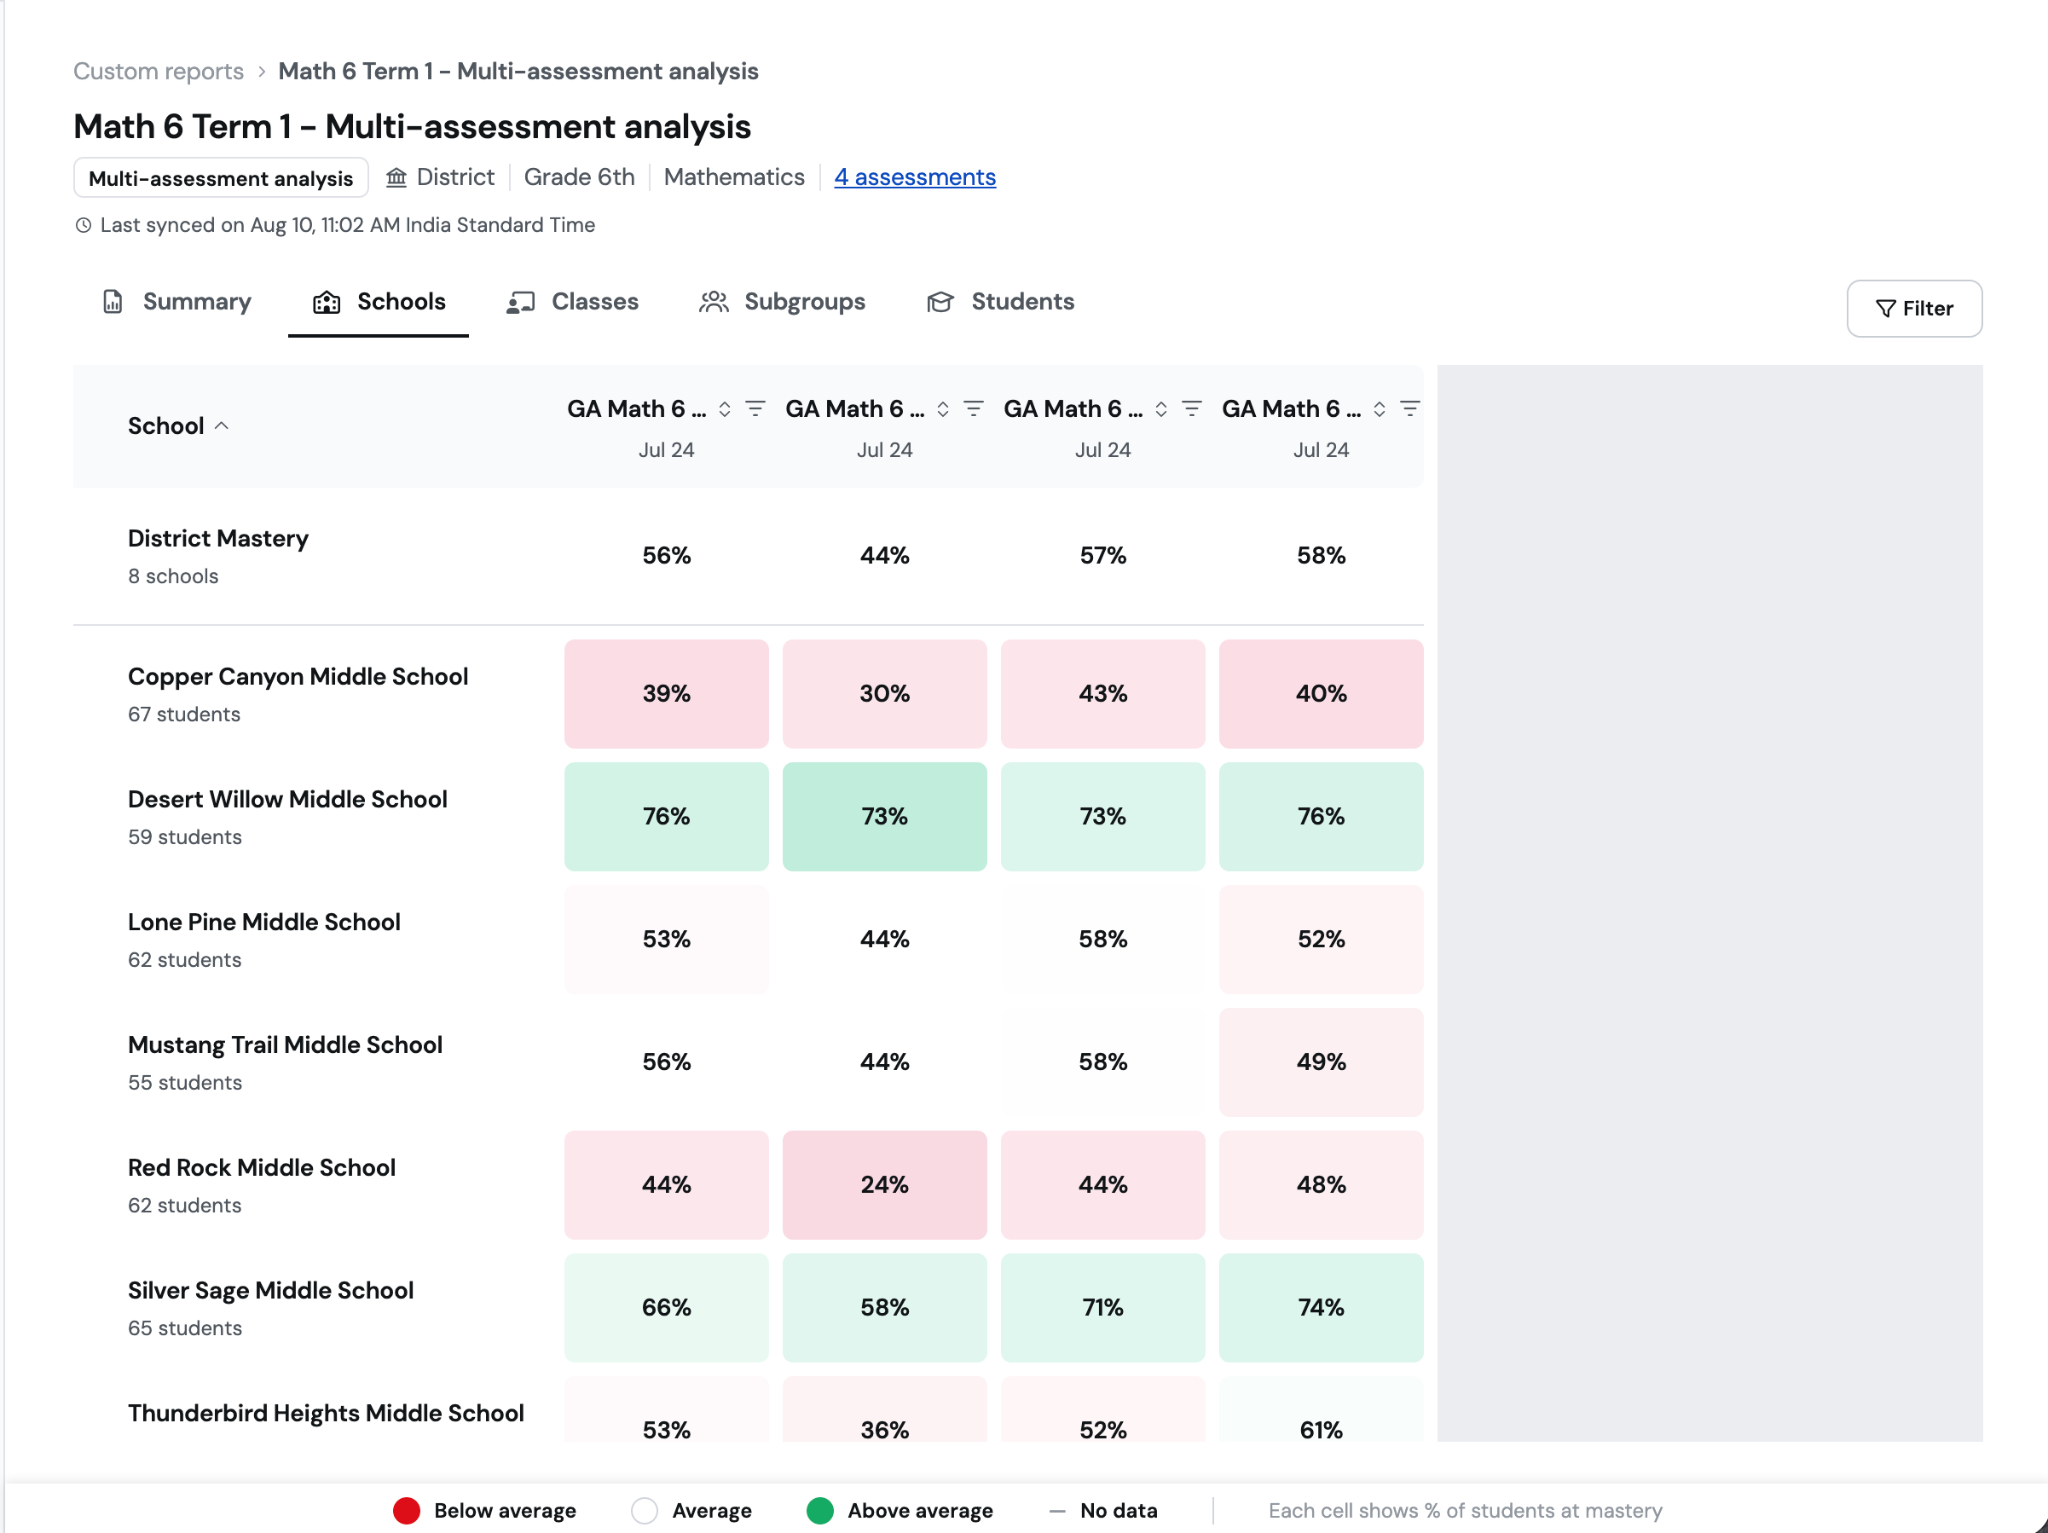
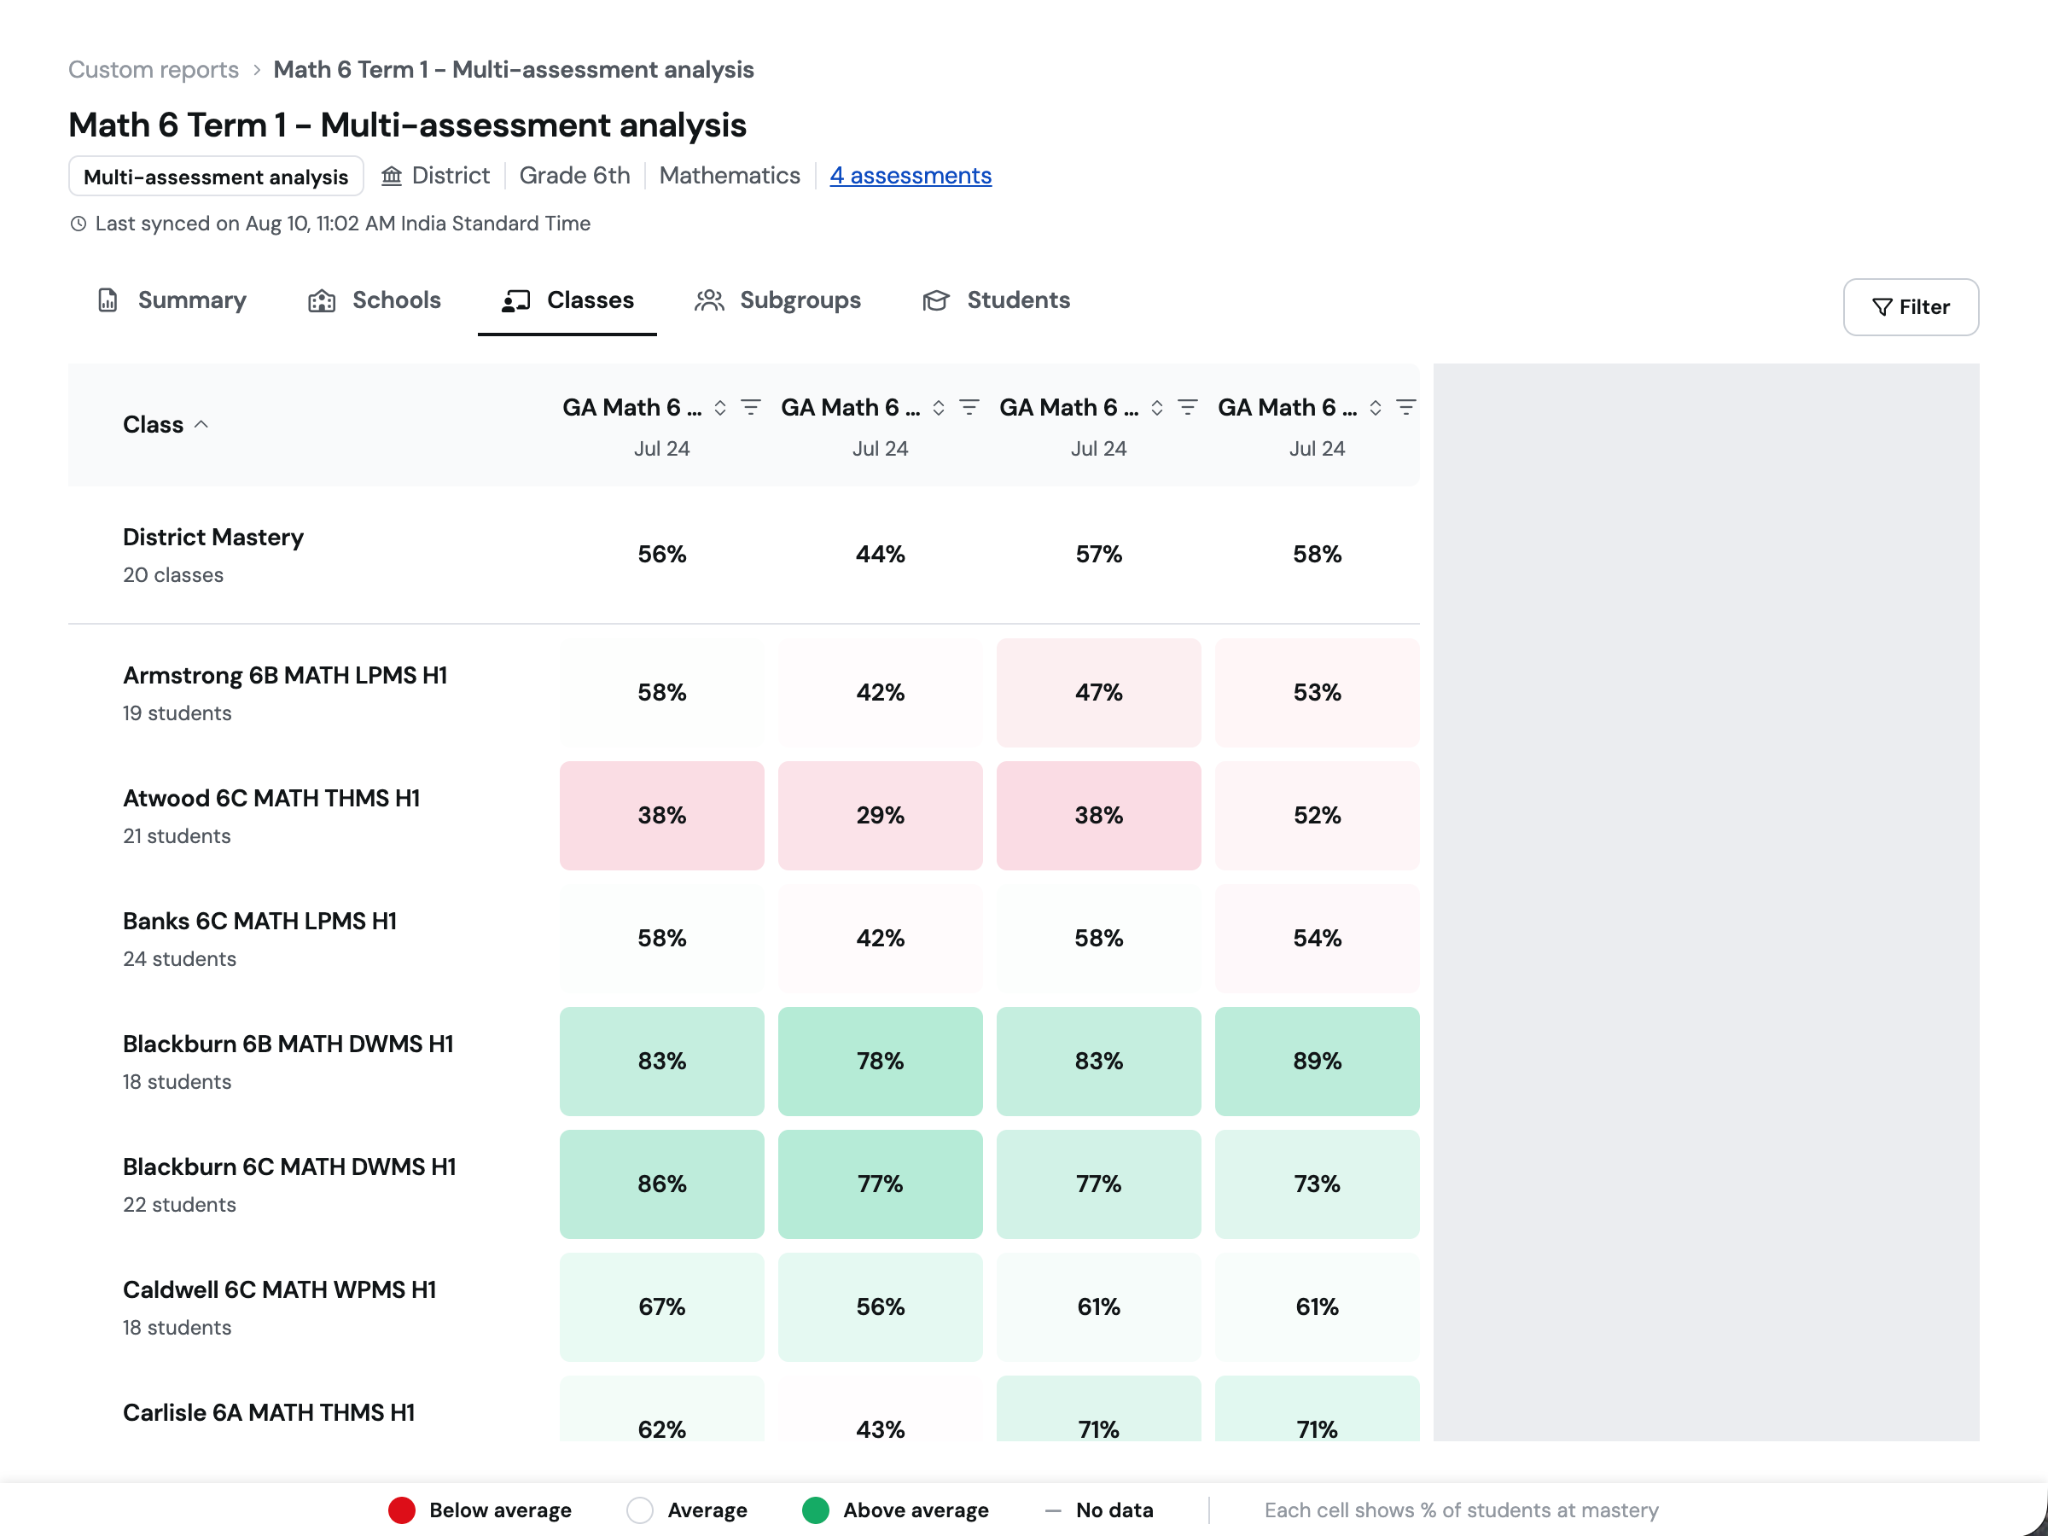
The Schools, Classes, and Subgroups tabs present a two-dimensional heatmap, with the selected groups in rows and assessments in columns. Each cell shows the % of students in the group that achieved mastery in the assessment. Read across a row to see one group’s pattern across assessments, or scan down a column to compare groups on one assessment. Sort or filter the heatmap by mastery to bring the most relevant groups or assessments into view.
Schools
Compare schools to identify districtwide strengths, shared needs, and school-specific patterns. Read across a school’s row to see its results across assessments; scan down an assessment’s column to compare that assessment across schools. Sort or filter the heatmap by mastery to focus on the range you want to examine.
You can use stronger results to identify schools whose approaches or resources could inform others. For weaker or uneven results, you can decide whether coordinated or school-specific support is needed. Click any cell to continue to its class, subgroup, and student results.
Classes
Compare classes to identify shared strengths and where targeted support may have the greatest impact. Read across a class’s row to see its results across assessments; scan down an assessment’s column to compare that assessment across classes. Sort or filter the heatmap by mastery to focus on the range you want to examine.
Stronger results can surface practices or resources worth discussing across the instructional team. For weaker or uneven results, you can decide what support would be most useful. Click any cell to continue to its subgroup and student results.
Subgroups
Compare subgroups to identify strengths and patterns that may warrant a closer look. Read across a subgroup’s row to see its results across assessments; scan down an assessment's column to compare that assessment across subgroups. Sort or filter the heatmap by mastery to focus on the range you want to examine.
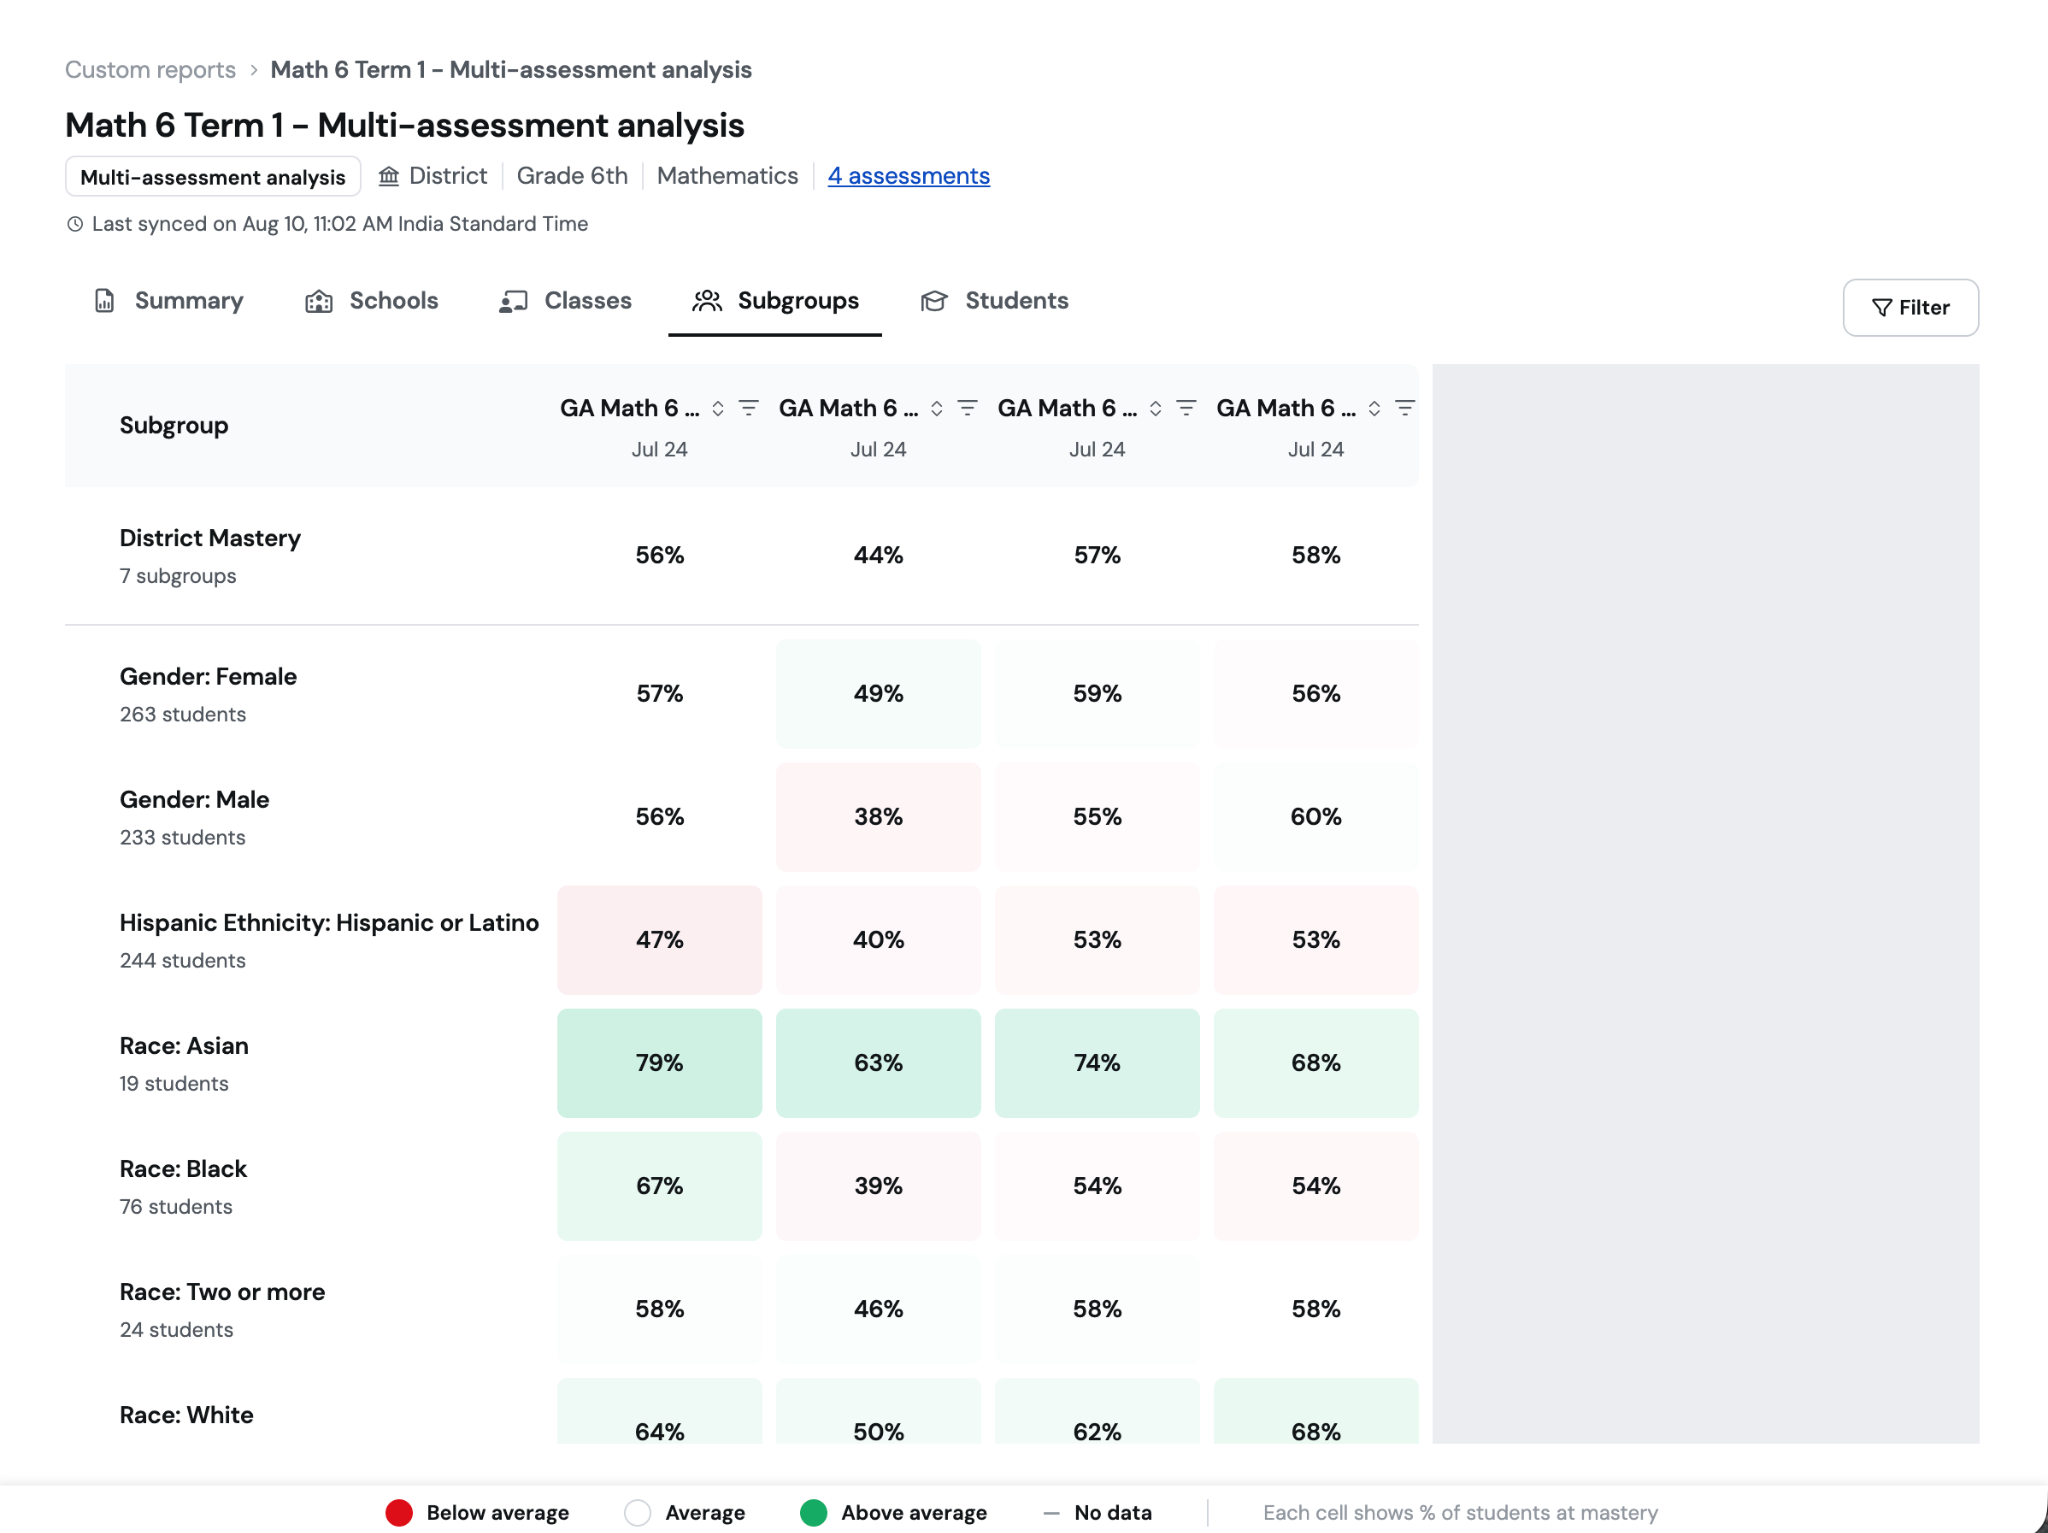
Note: Subgroups are available only if your district has connected Clever or ClassLink to Wayground and configured subgroups. Contact your Wayground Customer Success partner to enable this option.
Which students show consistent performance, improvement, or fluctuation?
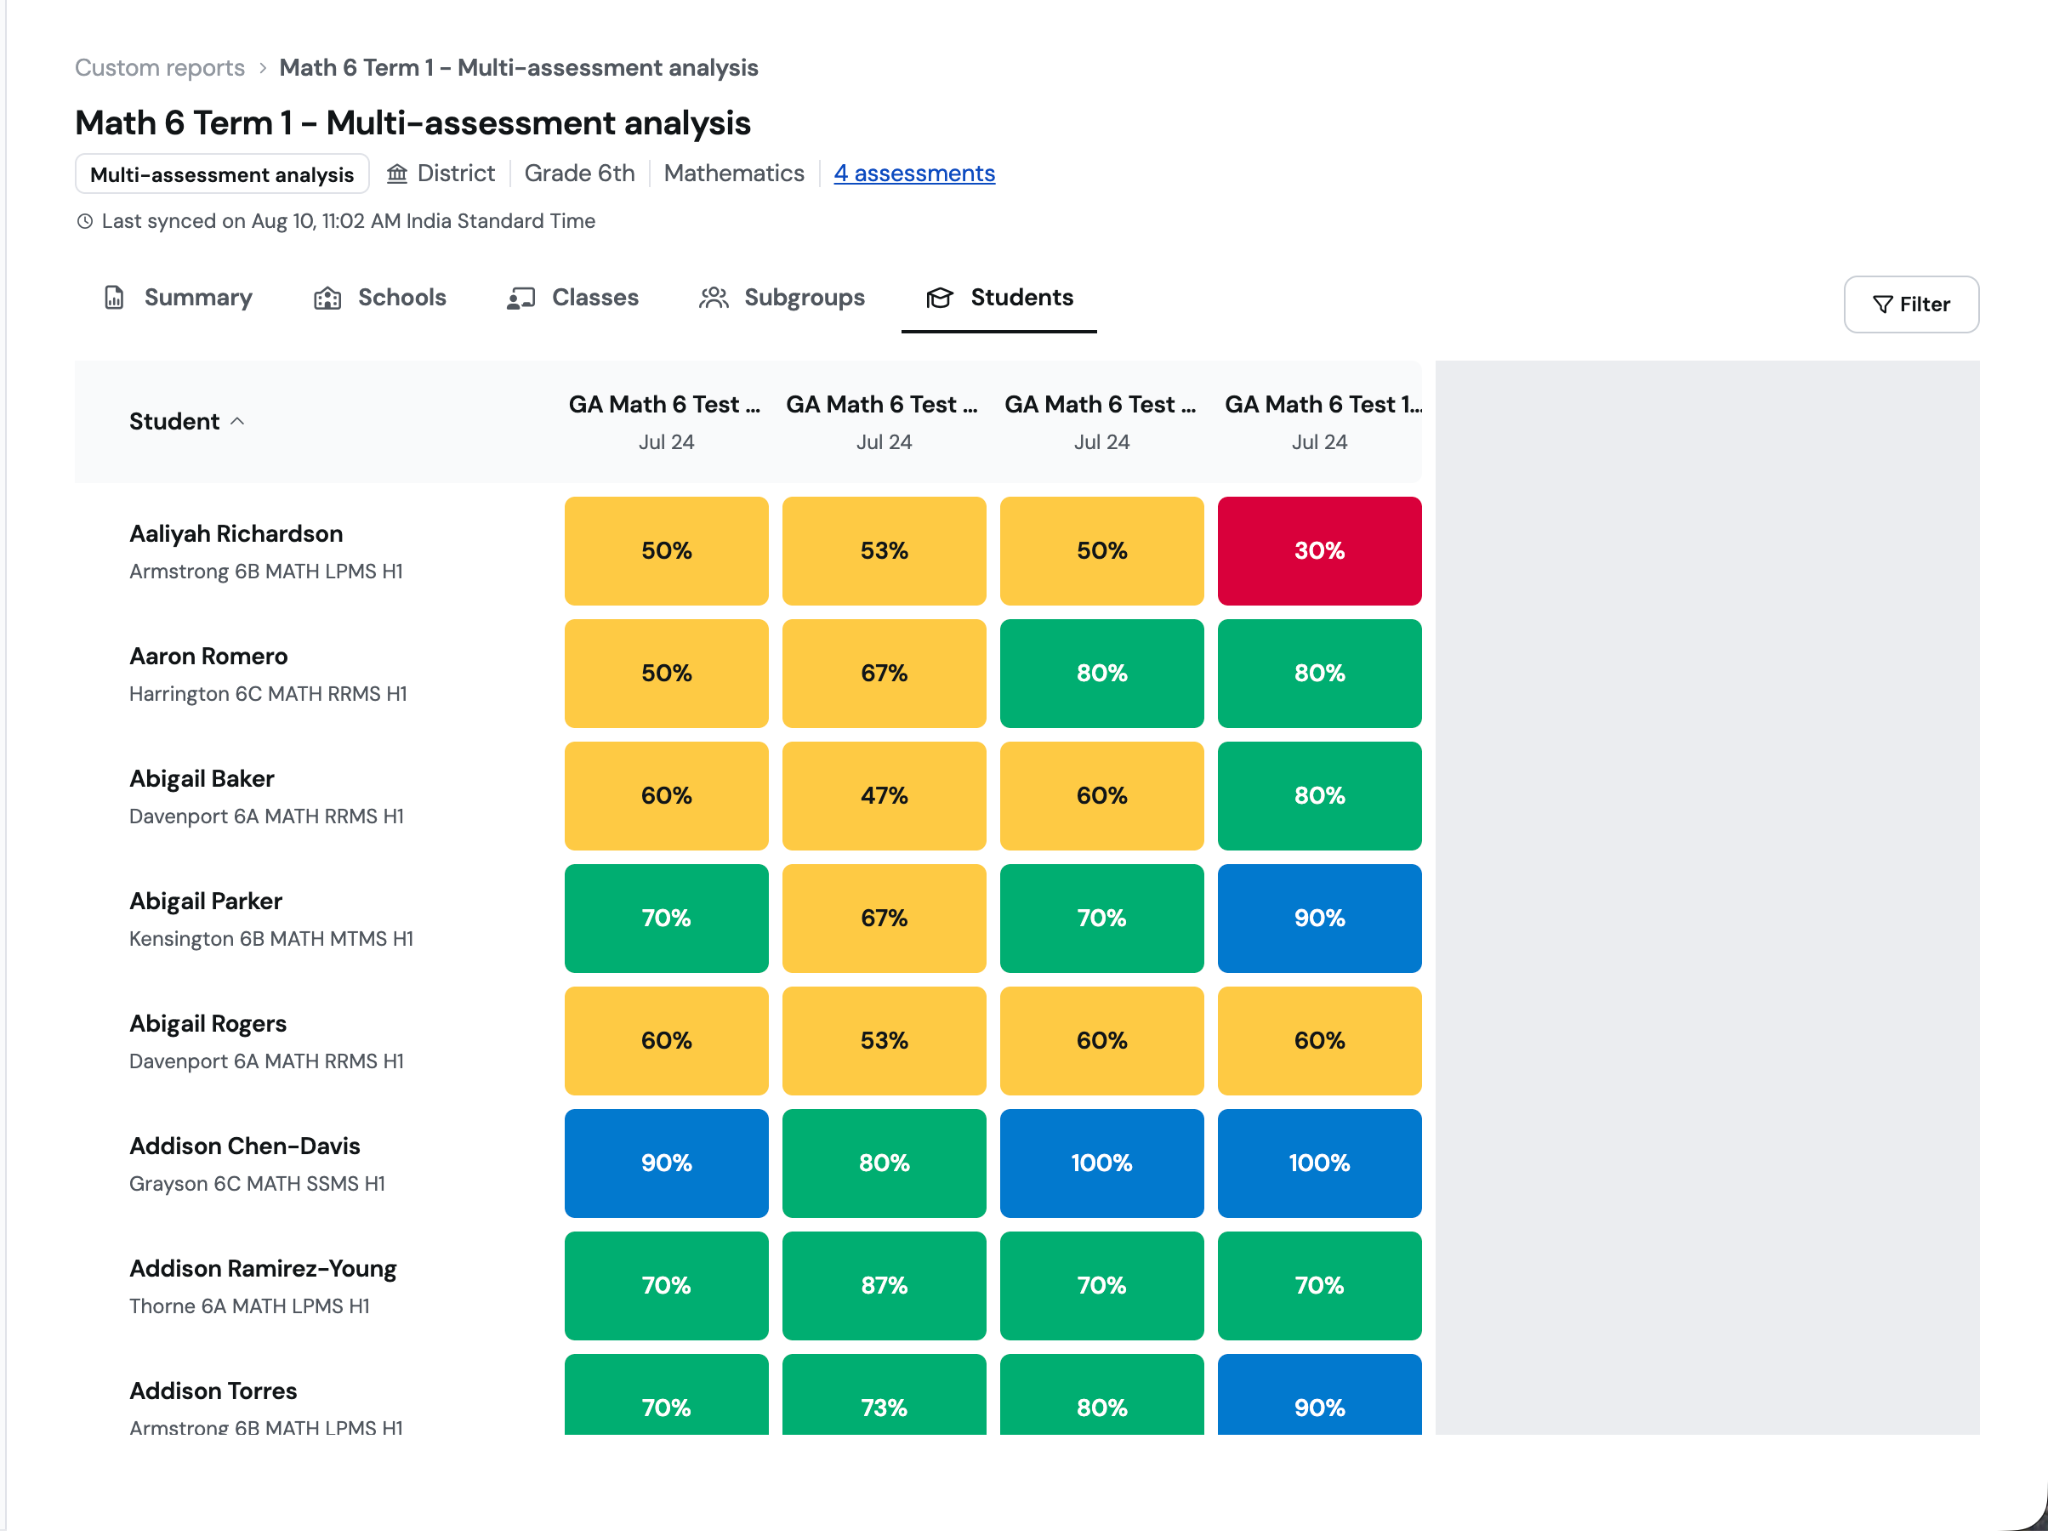
Use the Students view to compare each student’s results across the selected assessments.
Consistently strong results may point to an opportunity for extension or a deeper challenge.
Improving results may suggest approaches to reinforce and apply in the next unit.
Mixed or lower results may prompt a review of assessment conditions, content coverage, student work, and possible follow-up.
How can I look at Item Analysis for one of the assessments?
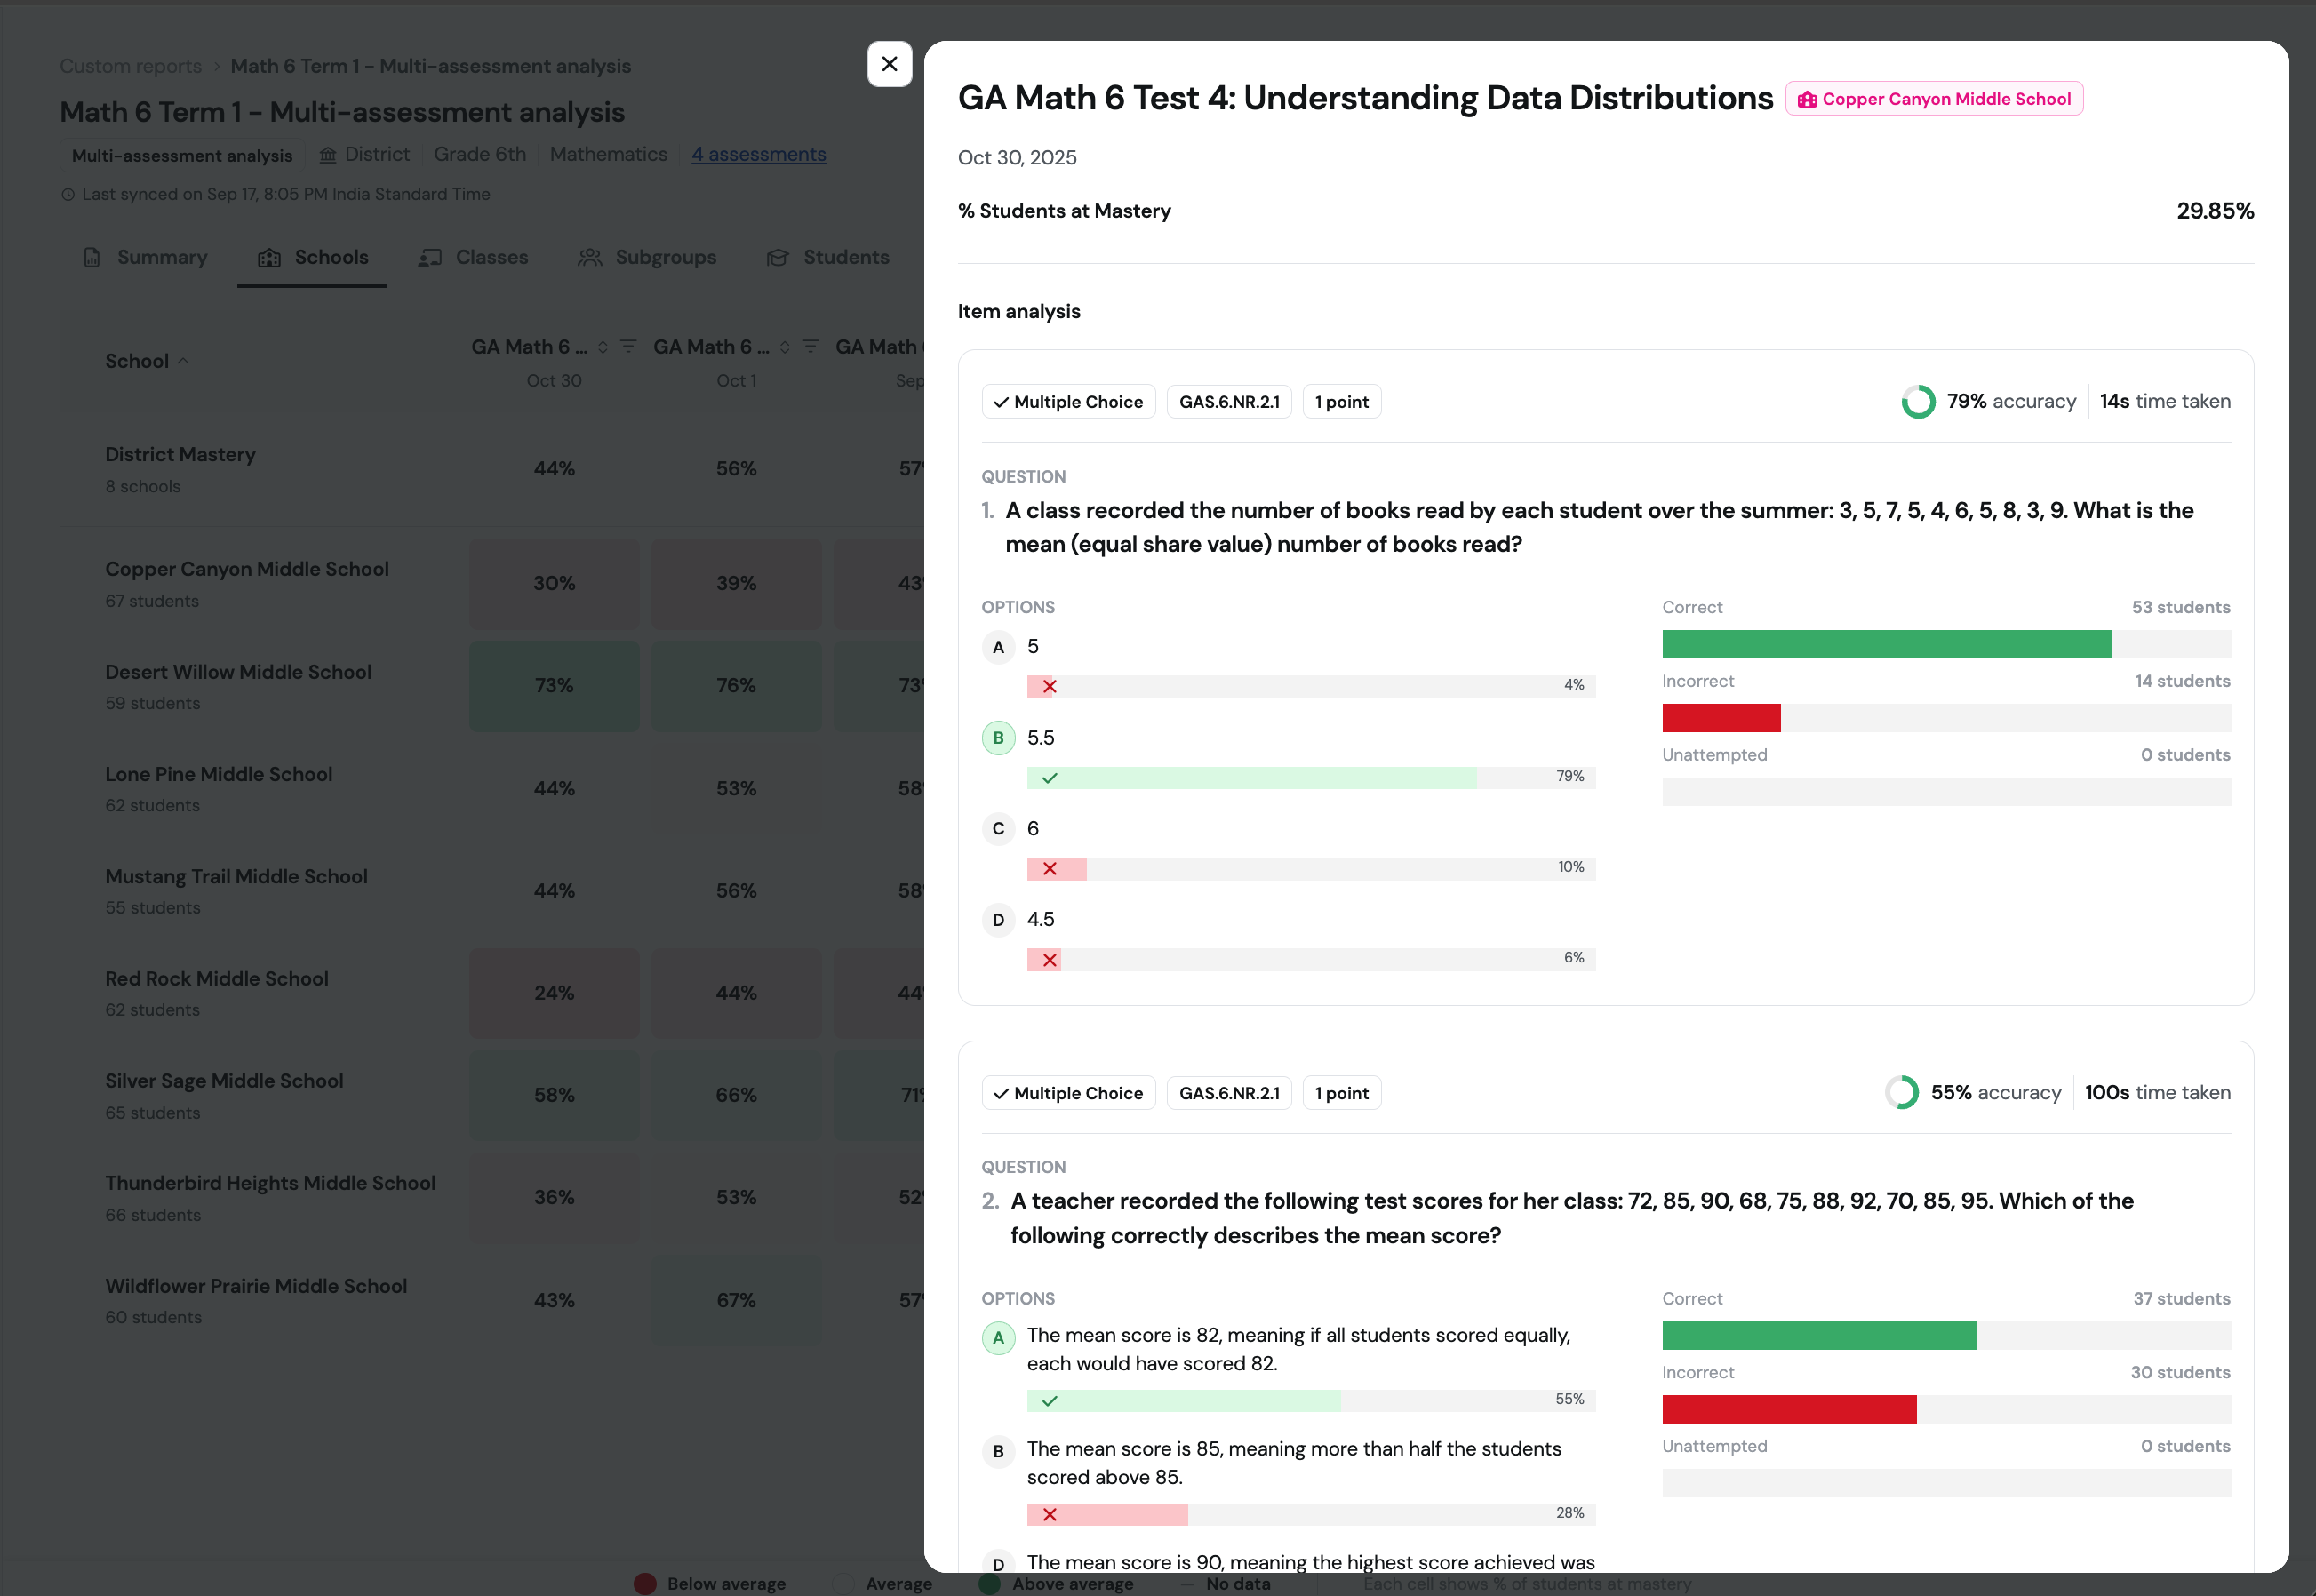
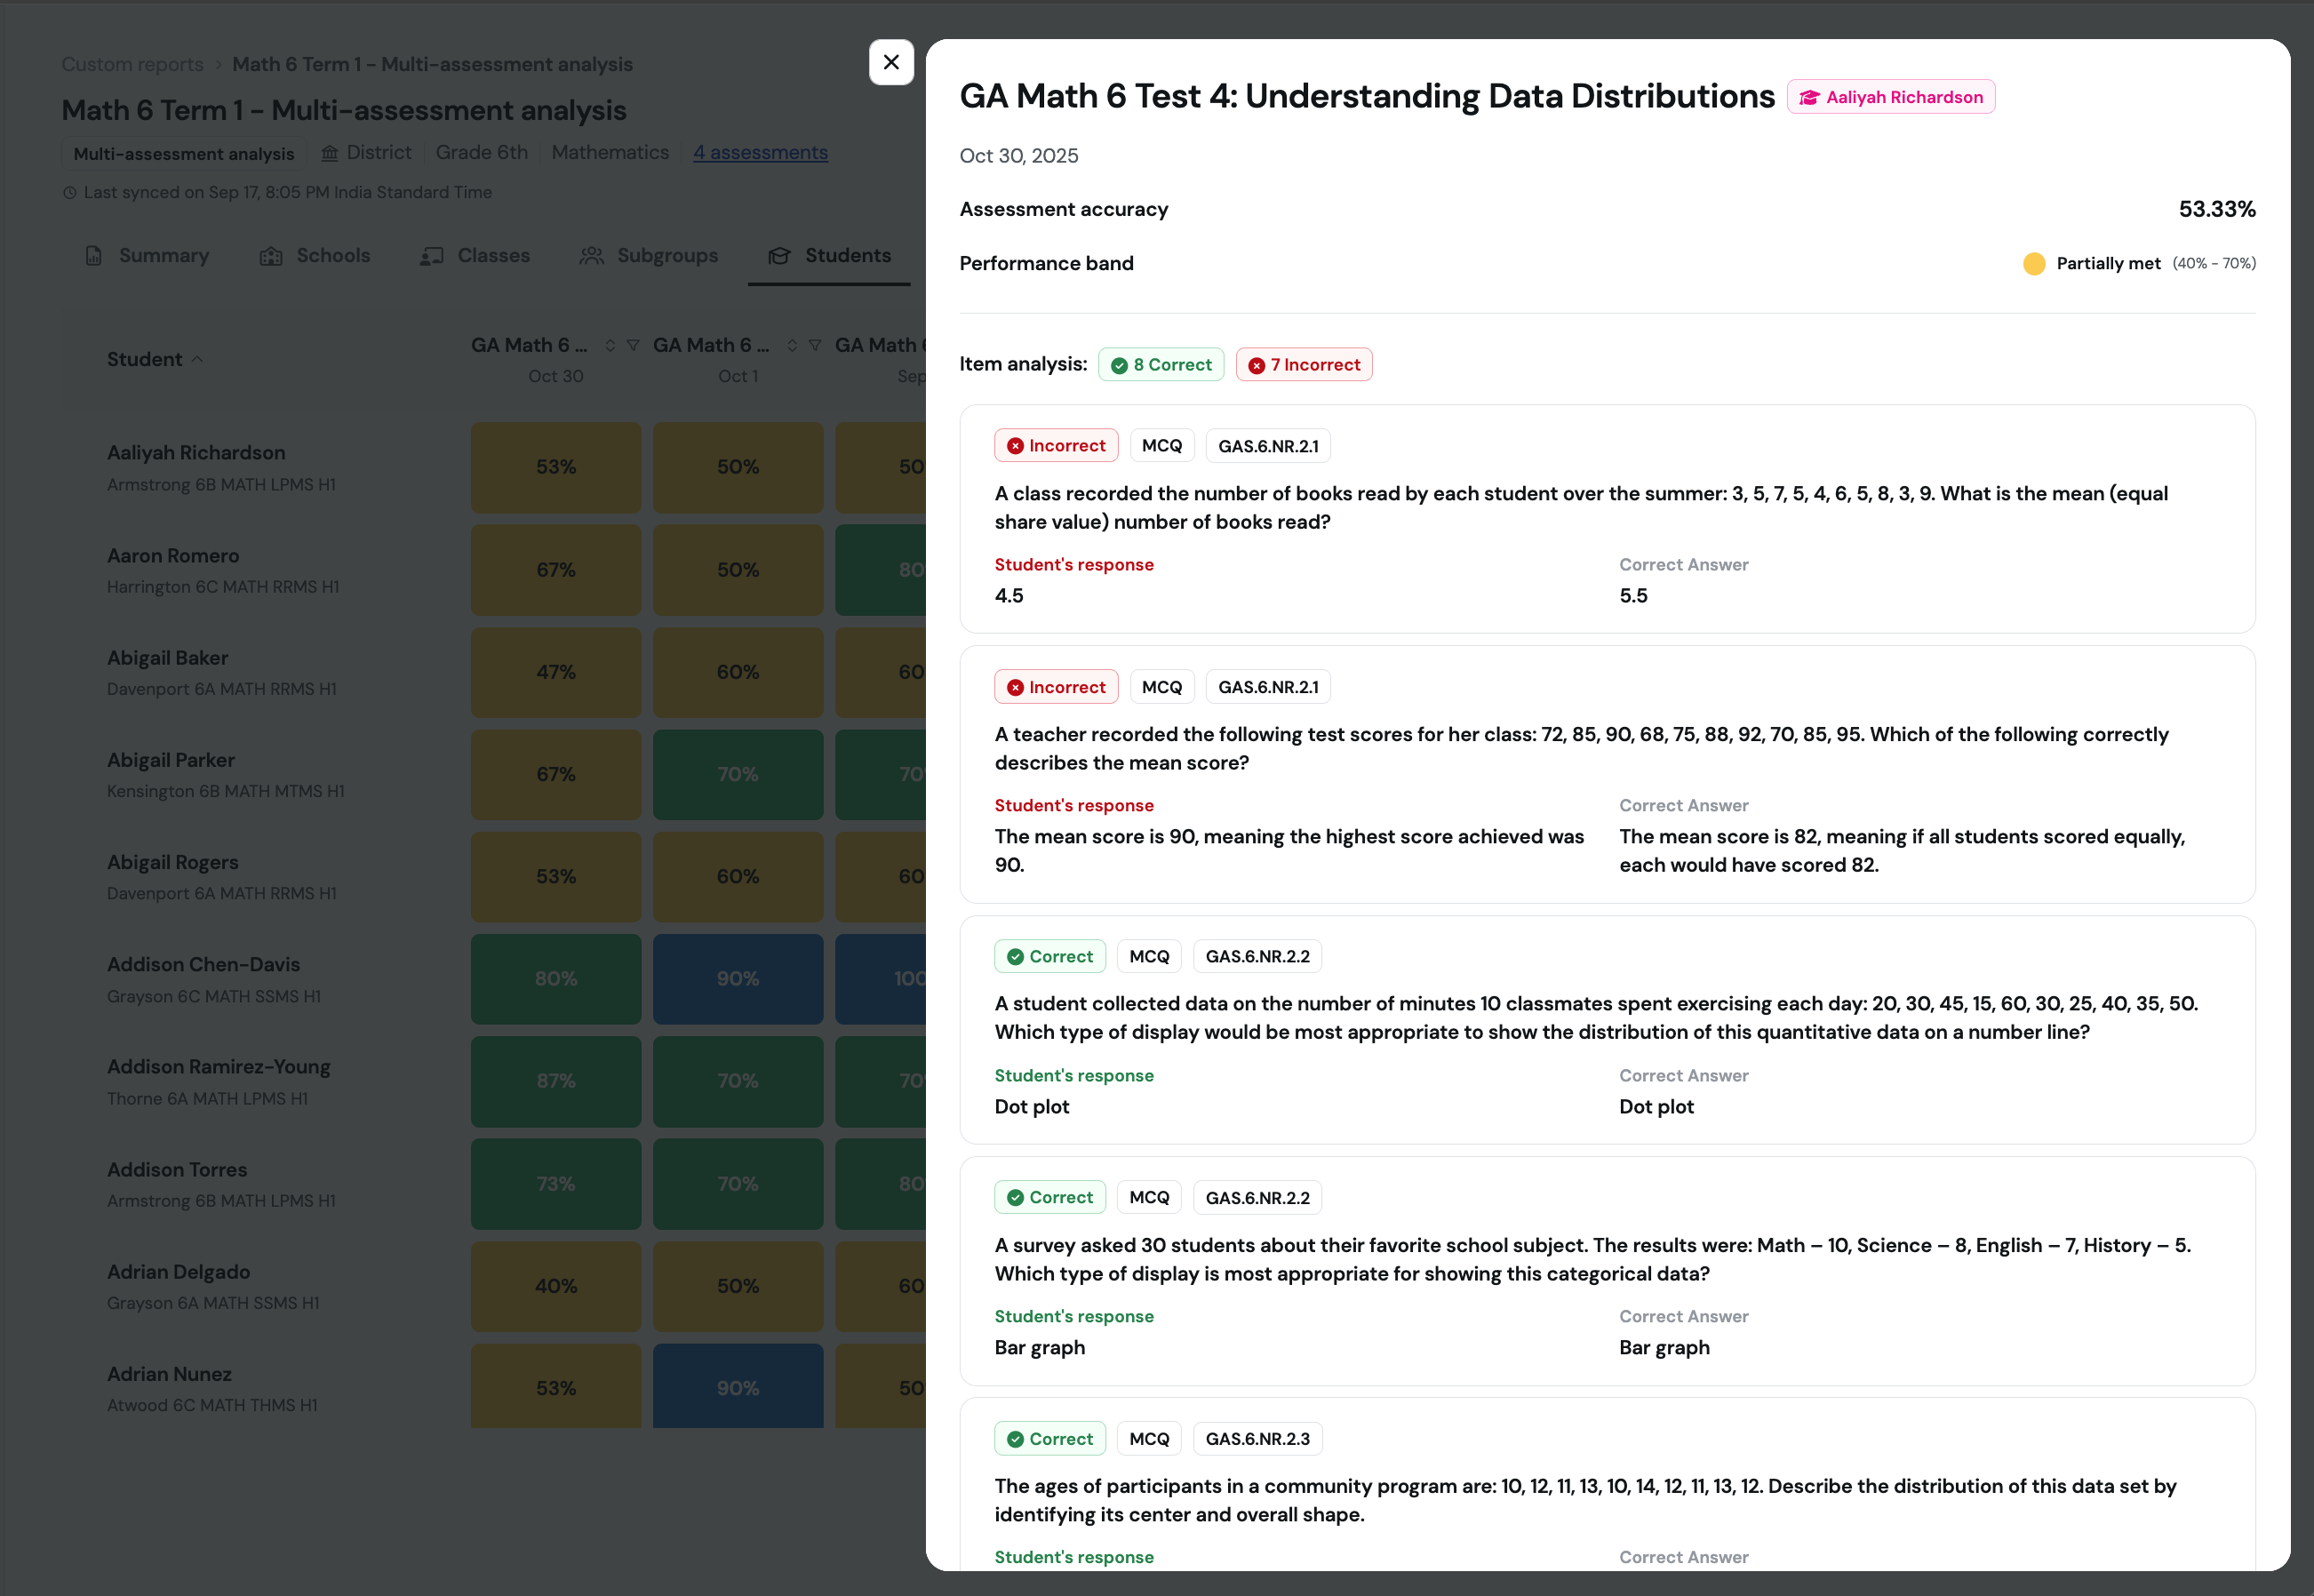
Click on any assessment or any cell in the heat map to reveal item analysis for that assessment and scope -
- Click on any assessment in the Summary tab to reveal its item analysis for the entire population selected in the report.
- Click on any cell in Schools, Classes, Subrgoups, and Students to reveal item analysis for that assessment (column) and that group (row - school, class, subgroup, or student)
How can I focus every report view on one population?
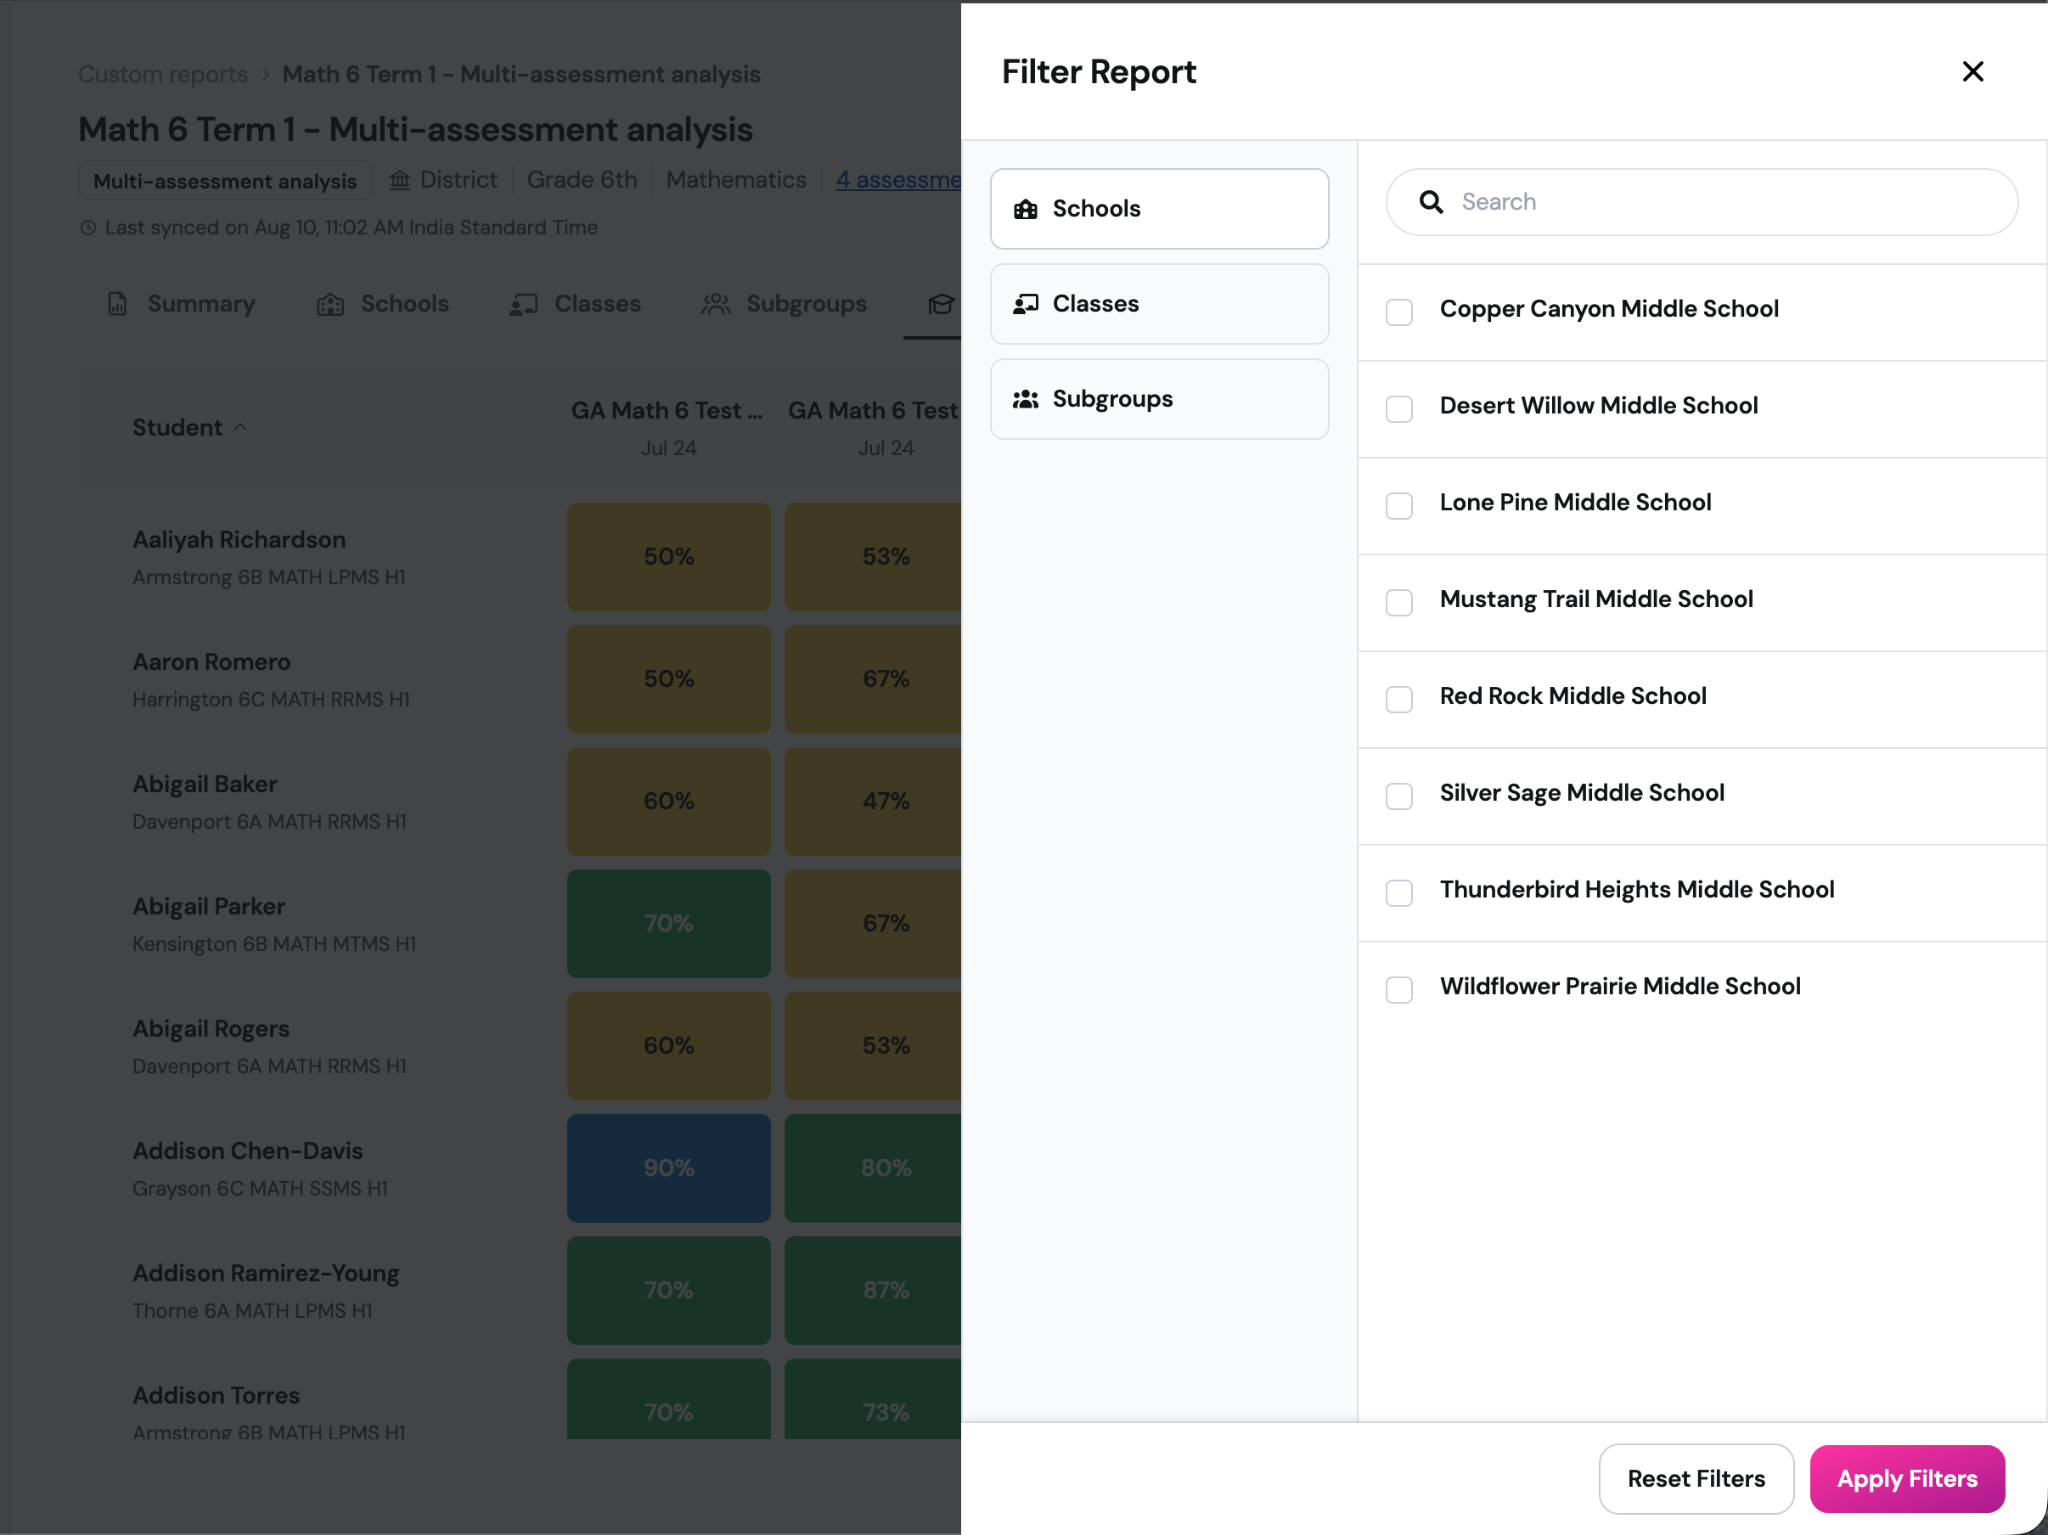
Use the Filter button in the upper-right corner of the report to narrow results by school, class, subgroup, or student. The filter applies to both the Summary and Students views, helping you examine the same population consistently. Clear the filter to return to the full report.
Was this article helpful?
That’s Great!
Thank you for your feedback
Sorry! We couldn't be helpful
Thank you for your feedback
Feedback sent
We appreciate your effort and will try to fix the article