Note: Custom Reports are available as a part of Common Assessments add-on. To access this feature and learn more about Common Assessments add-on and the Schools & Districts plan, please email sales@wayground.com
A Standards Mastery Report enables tracking mastery on all the evaluated standards in two or more common assessments.
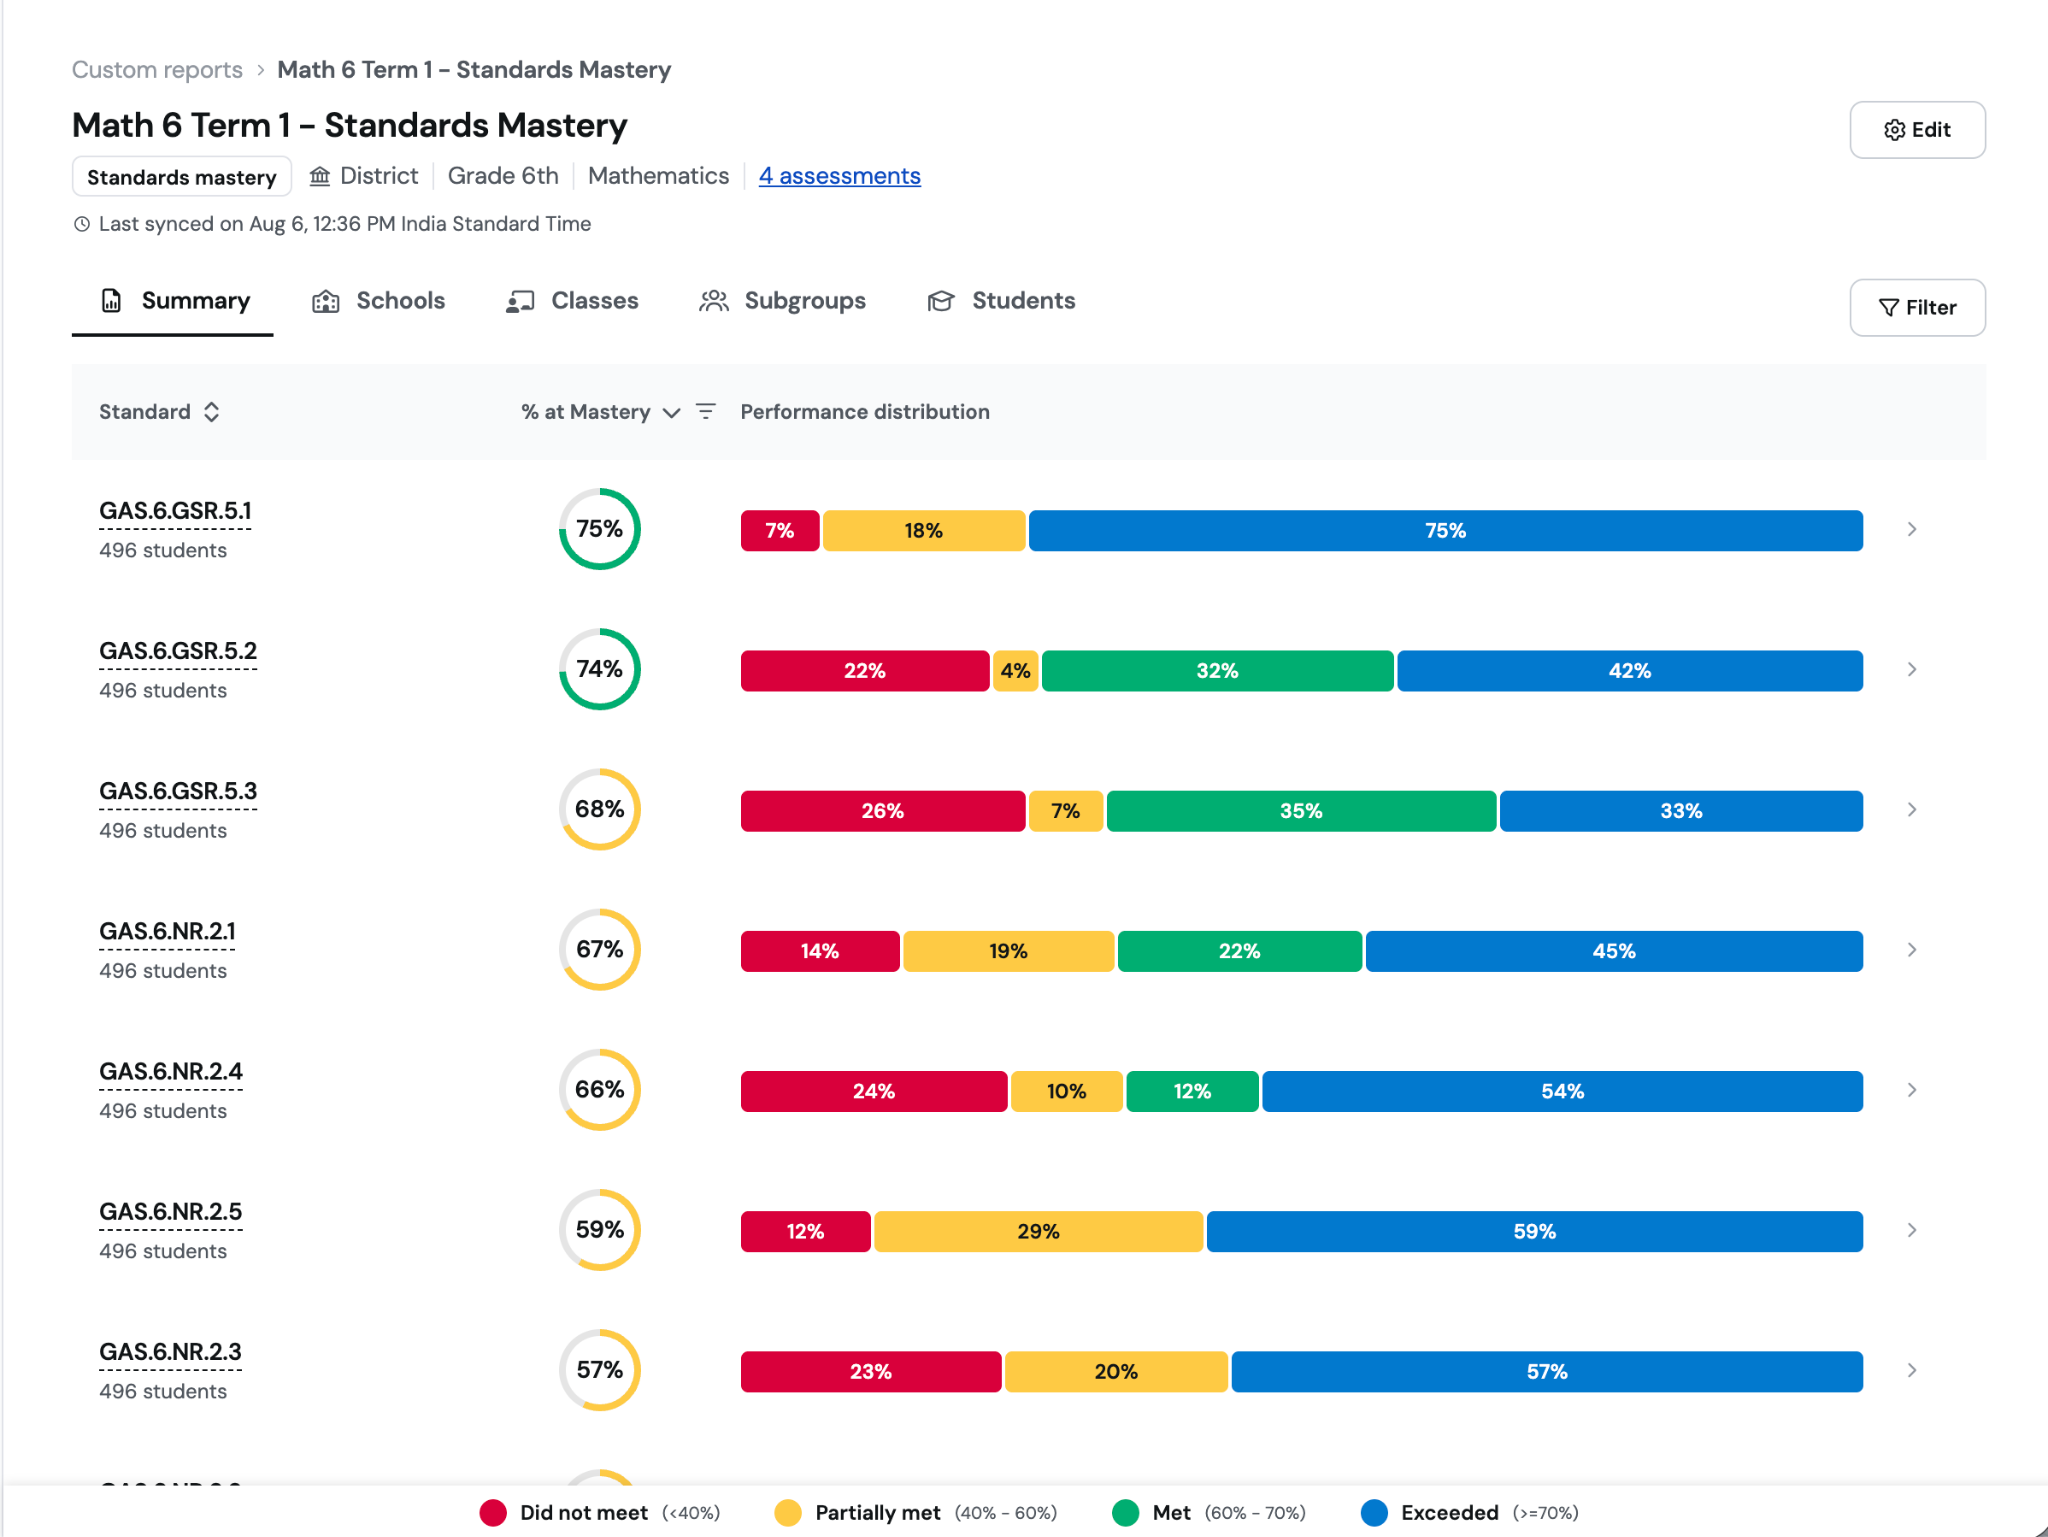
For a quick start guide, refer to this help center article: [Admins] [Quick Start] Create a Standards Mastery Report
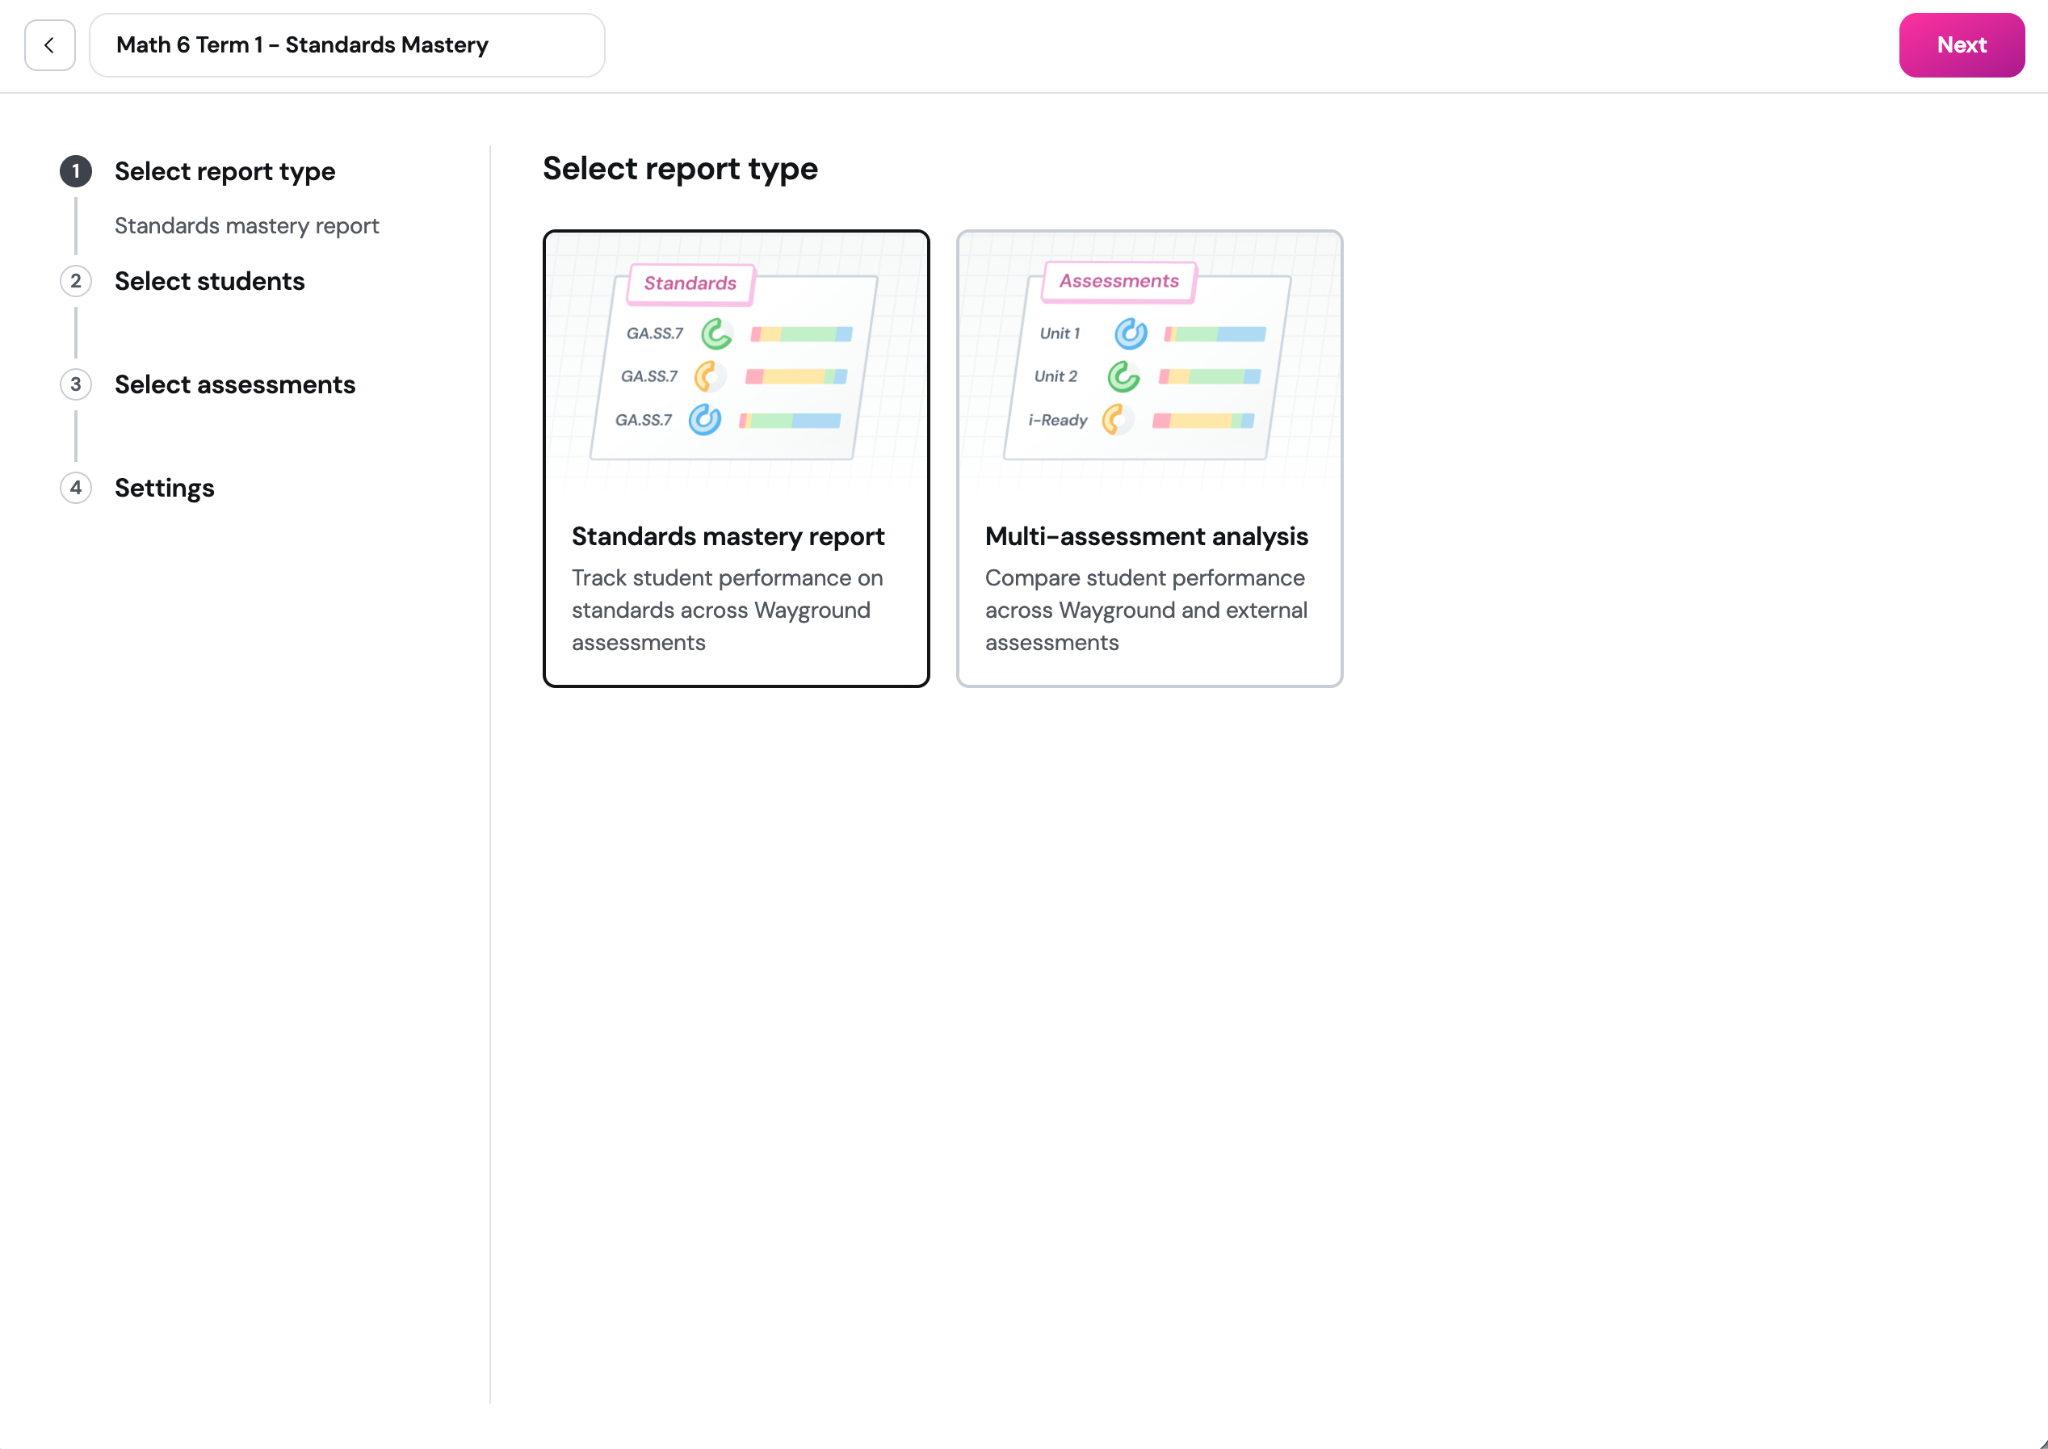
Step 1: Name your report and select type of report
Go to Sessions → Custom Reports
Click Create new report
Enter a descriptive name
Select “Standards mastery report”
Step 2 - Part 1: Choose how student results are grouped
Students’ schools, classes, and subgroups may change over time, so this step lets you choose how Wayground should place each student’s results in the report’s school, class, and subgroup views.
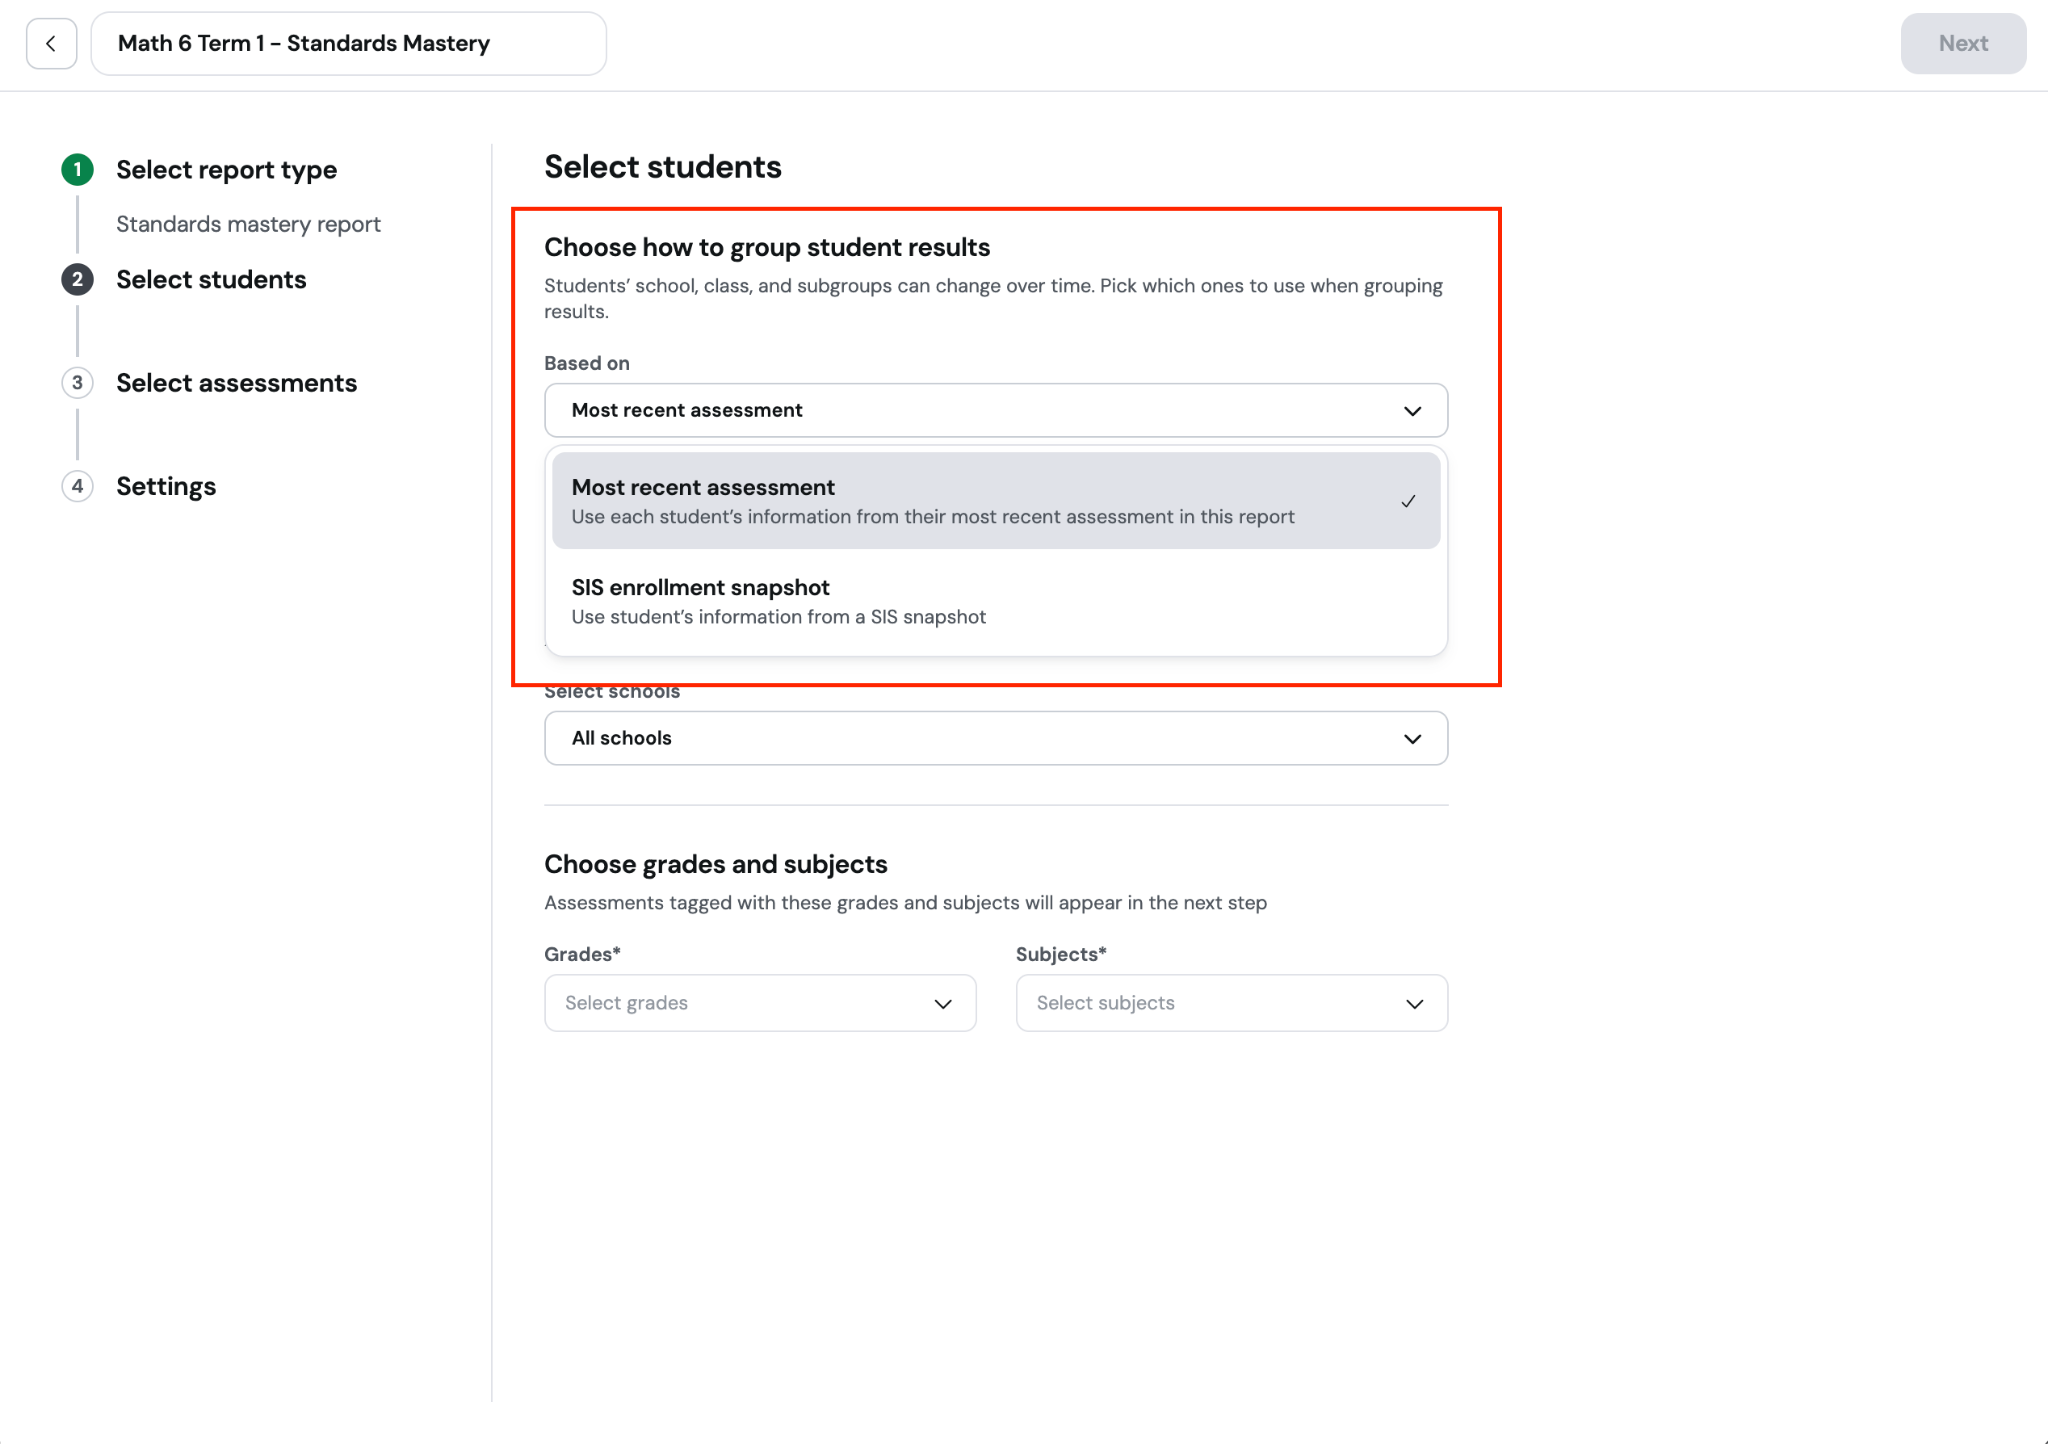
Most recent assessment
Choose this option to view each student under the school, class, and subgroup associated with their most recent selected assessment. Placement is determined student by student, so if a student missed the latest assessment, Wayground uses that student’s most recent participating assessment.
Use this strategy to identify where struggling students are currently, so you can direct support to the right schools and classes.
For example -
SIS enrollment snapshot
Available when your district connects Clever/Classlink to Wayground, choose this option when you want grouping to follow student rosters from a specific date.
After selection:
Choose a snapshot date. Wayground will use each student’s school and class assignments as they appeared on that date. The most recent available snapshot is selected by default.
Select one or more courses.
Select one or more terms.
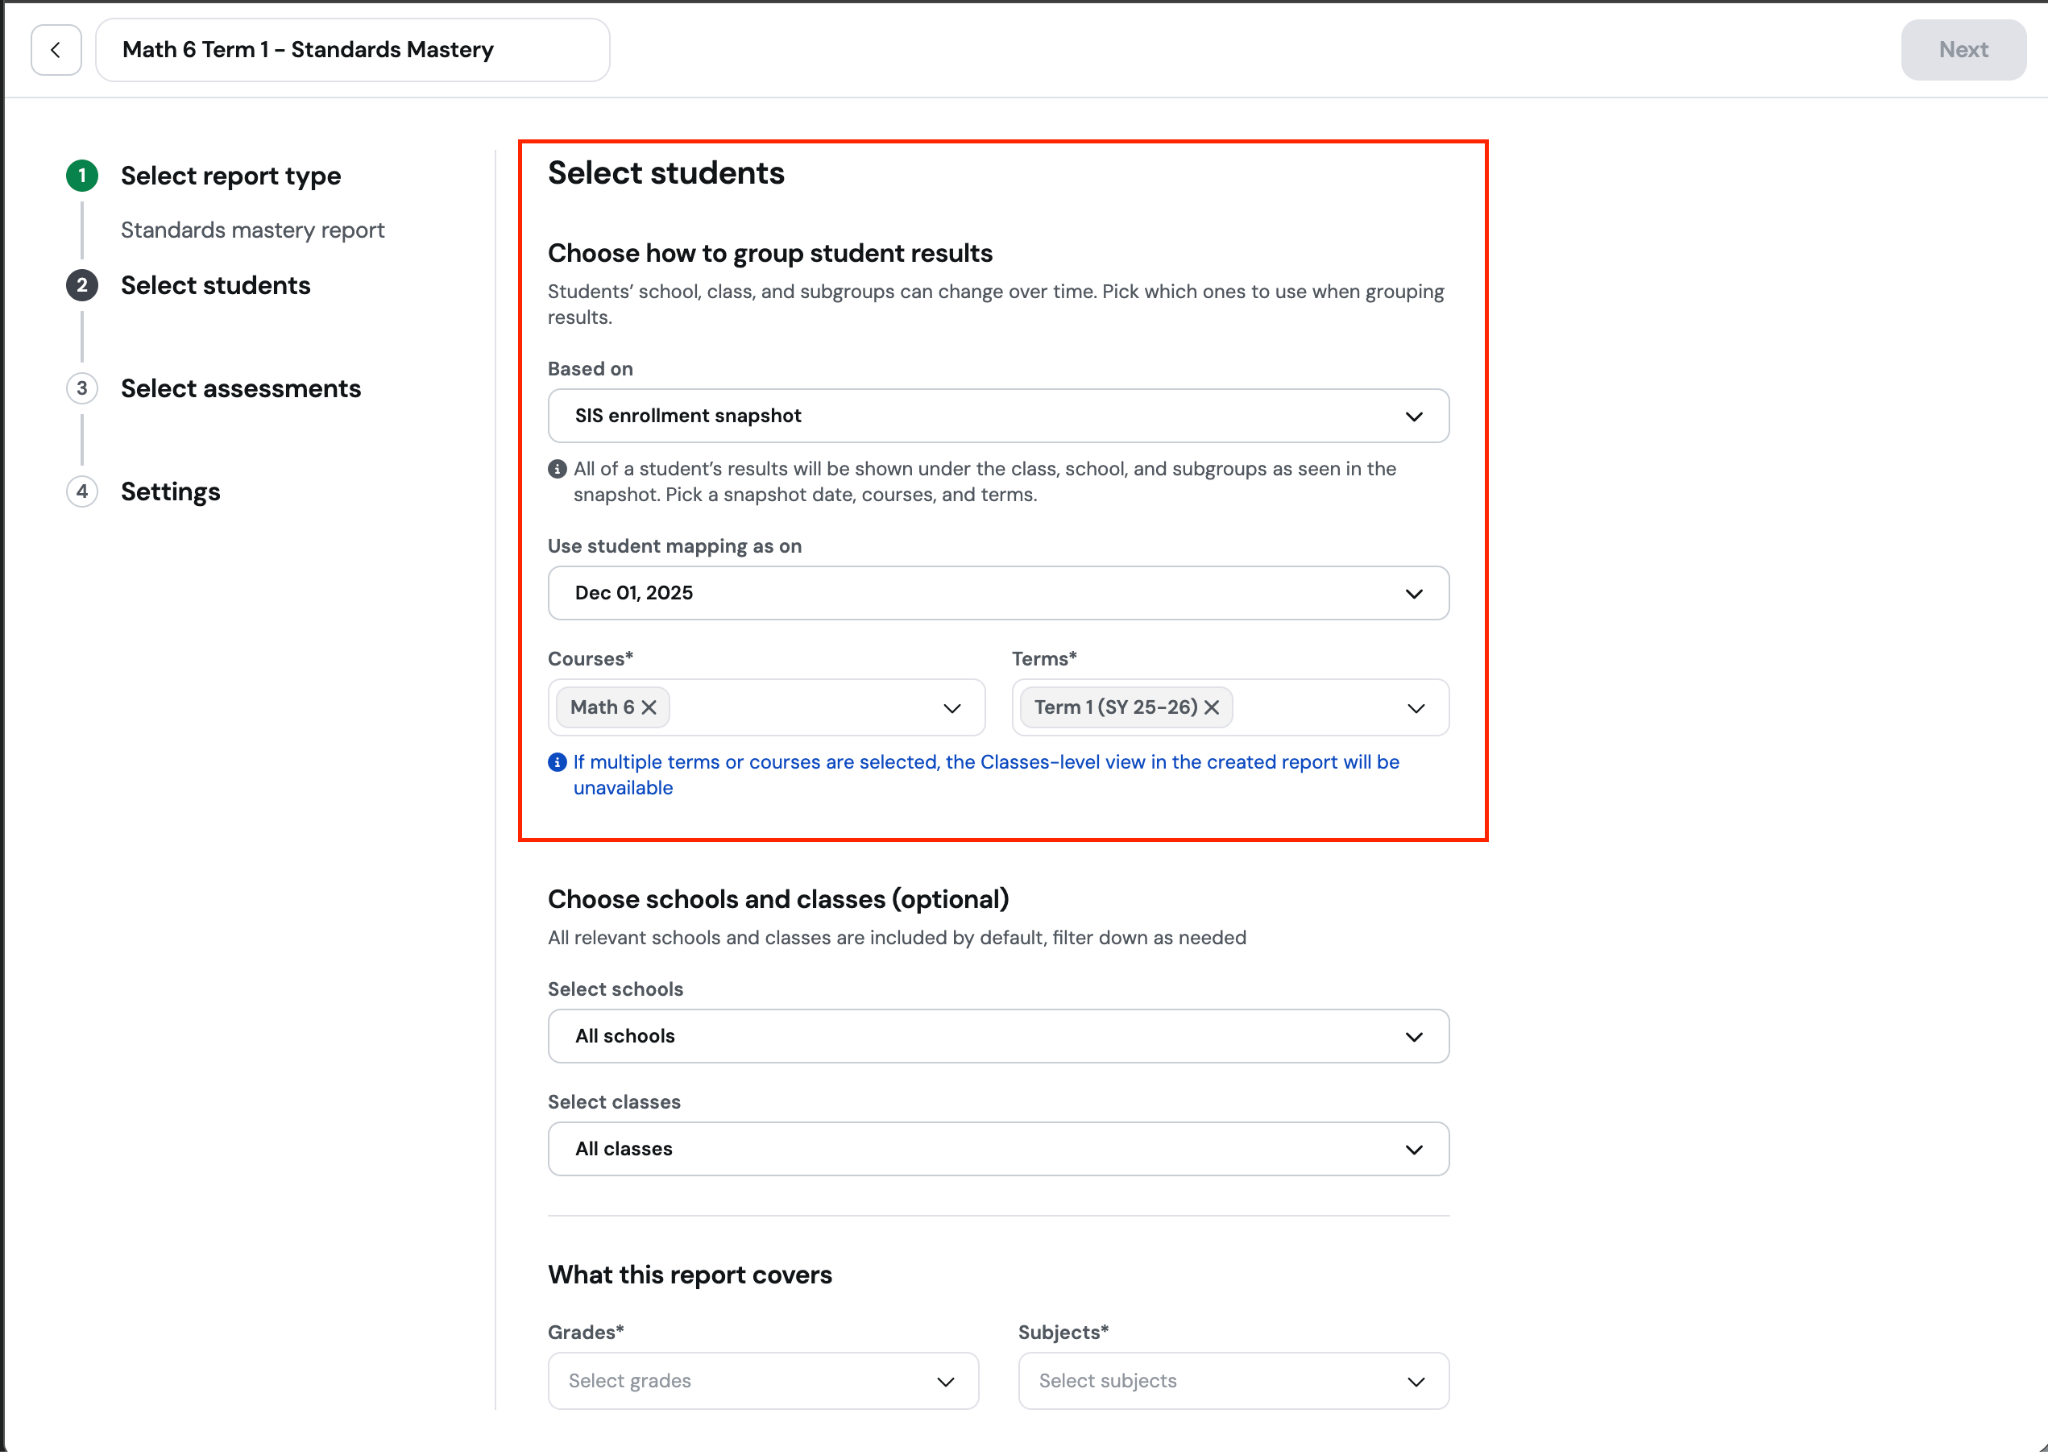
Note: If you select multiple courses or terms, a student may be associated with different classes across those selections. To prevent results from being attributed to or combined under the wrong groups, Wayground hides the class-level breakdown in the completed report. To view results by class, select one course and one term.
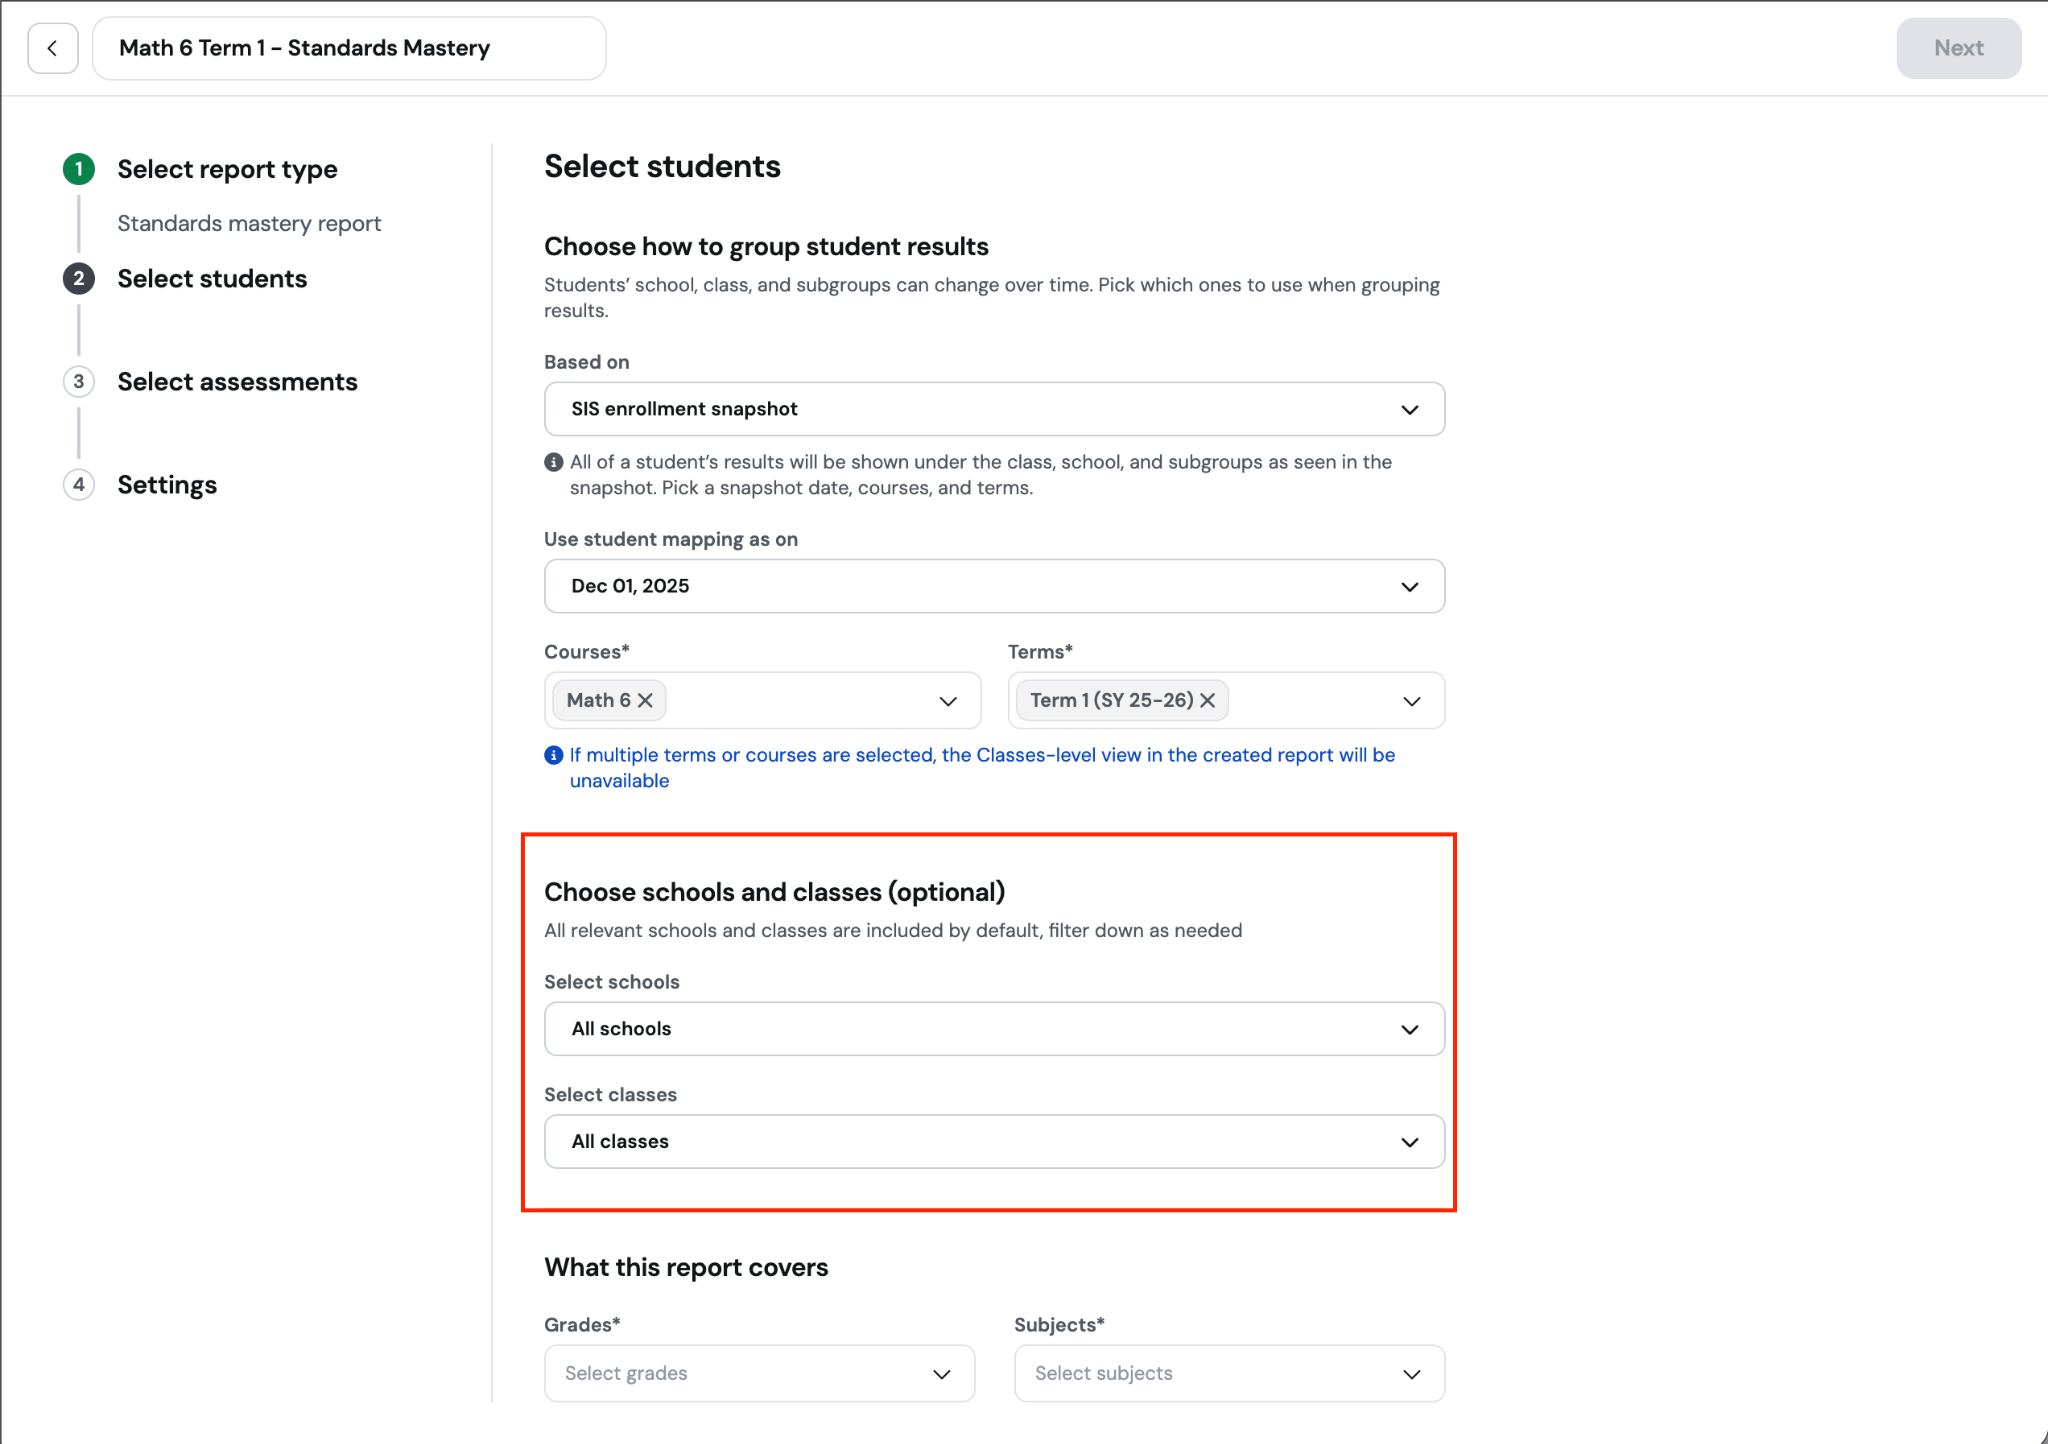
Step 2 - Part 2: Filter by schools and classes
Filtering is optional. Leave “All schools” selected to include every participating school. If you selected an SIS snapshot in the previous section, you can also filter by classes. Configured subgroup filters appear automatically in the completed report.
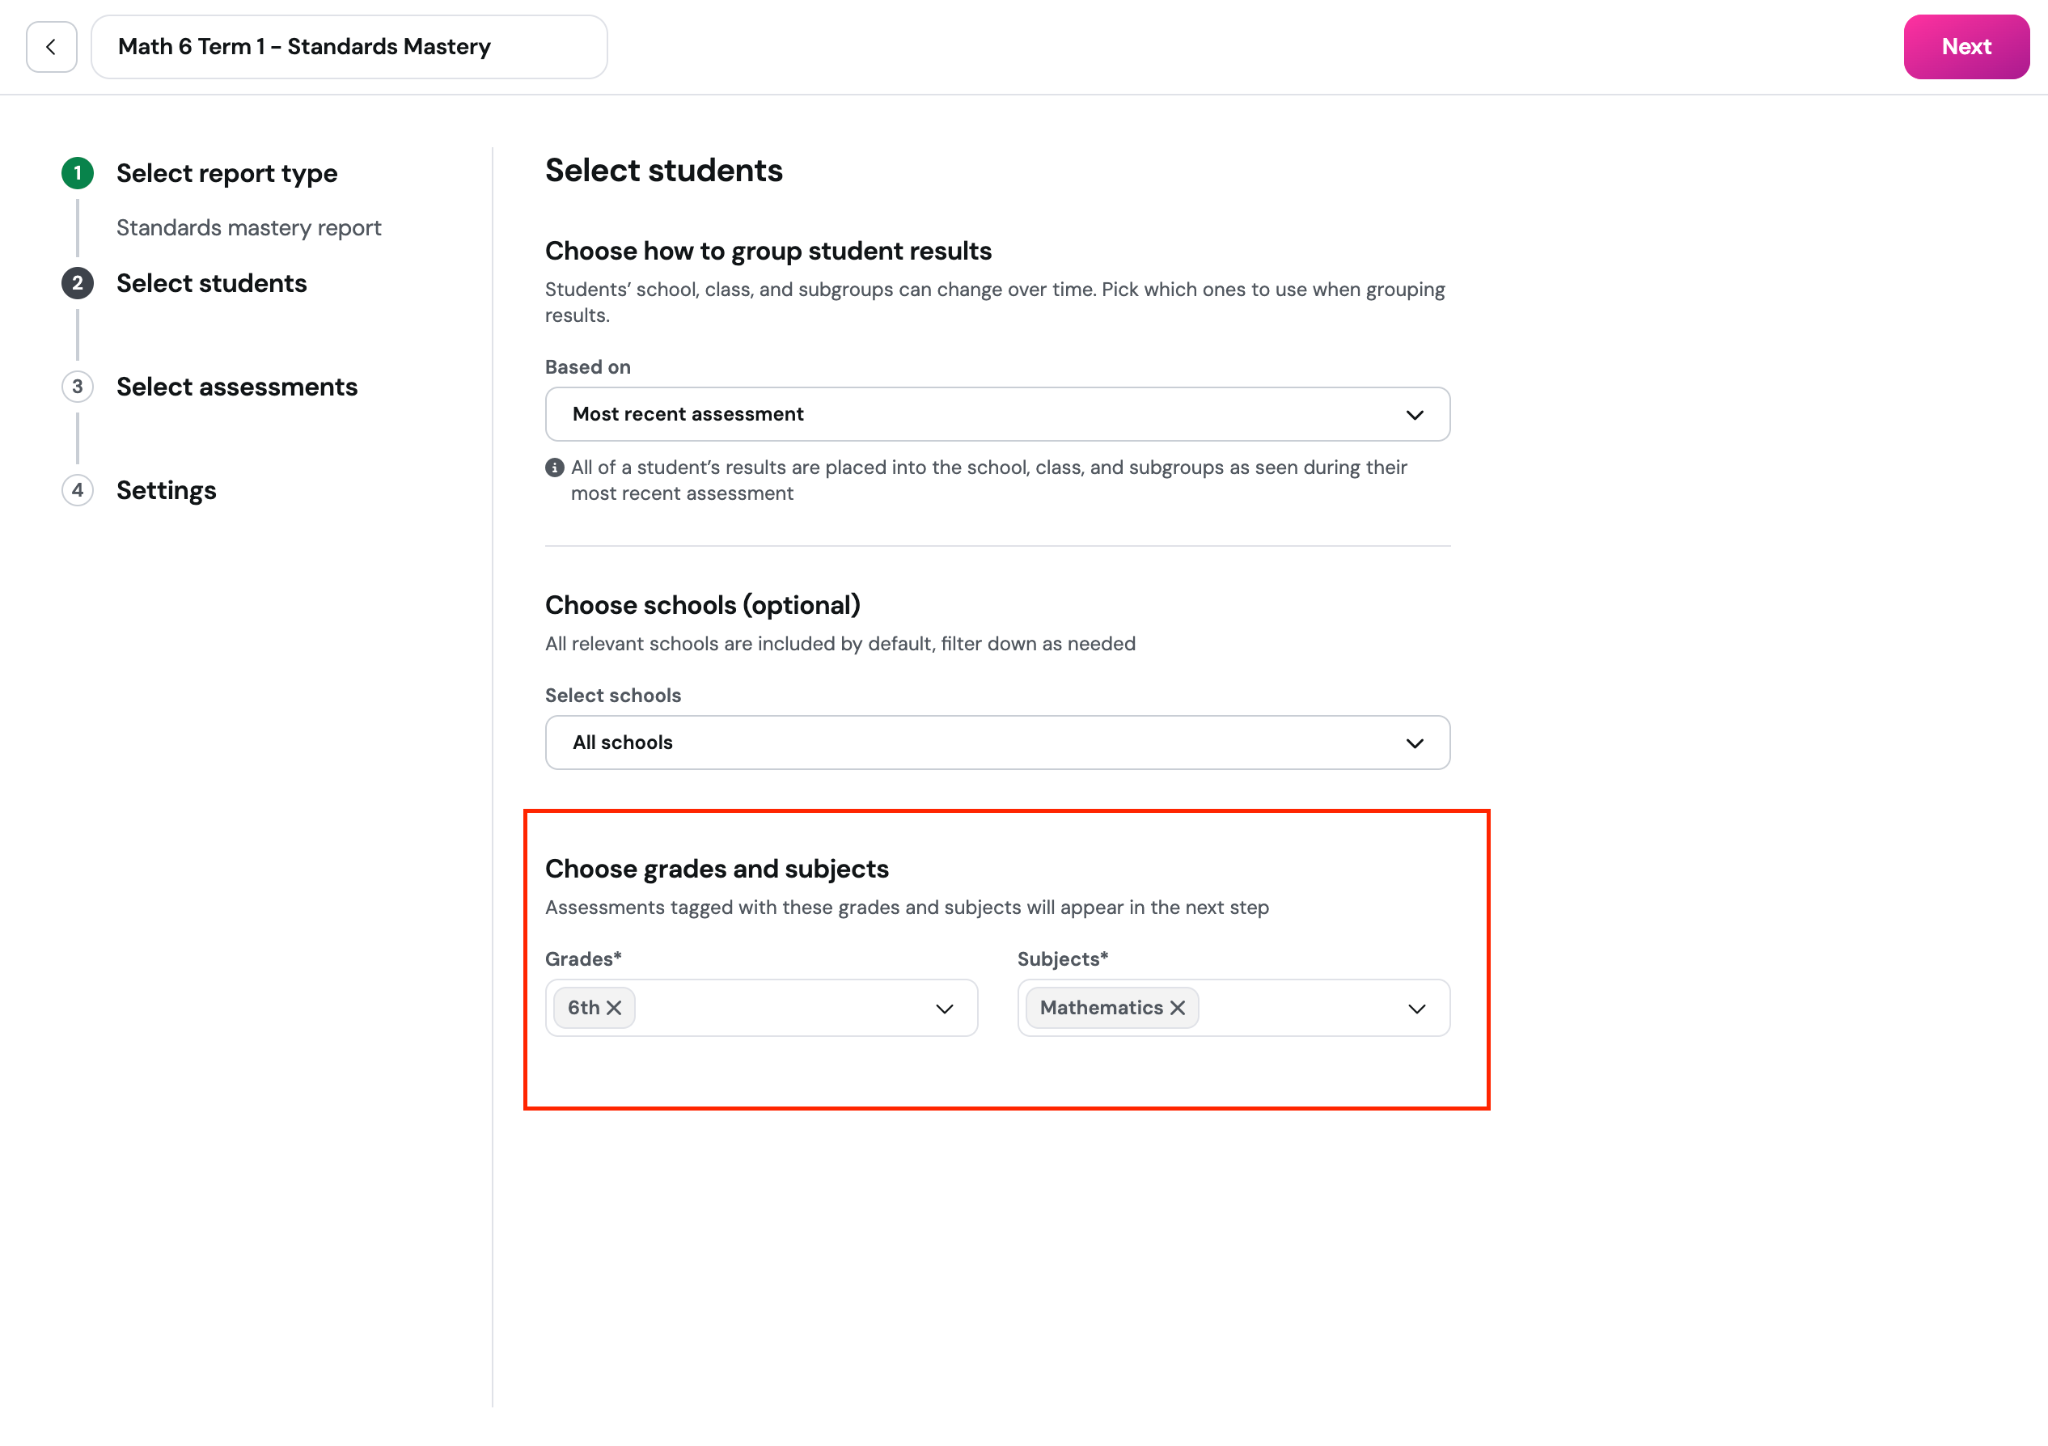
Step 2 - Part 3: Choose grades and subjects
These selections narrow the assessment list in the next step. Select the grade and subject for the report, then click Next.
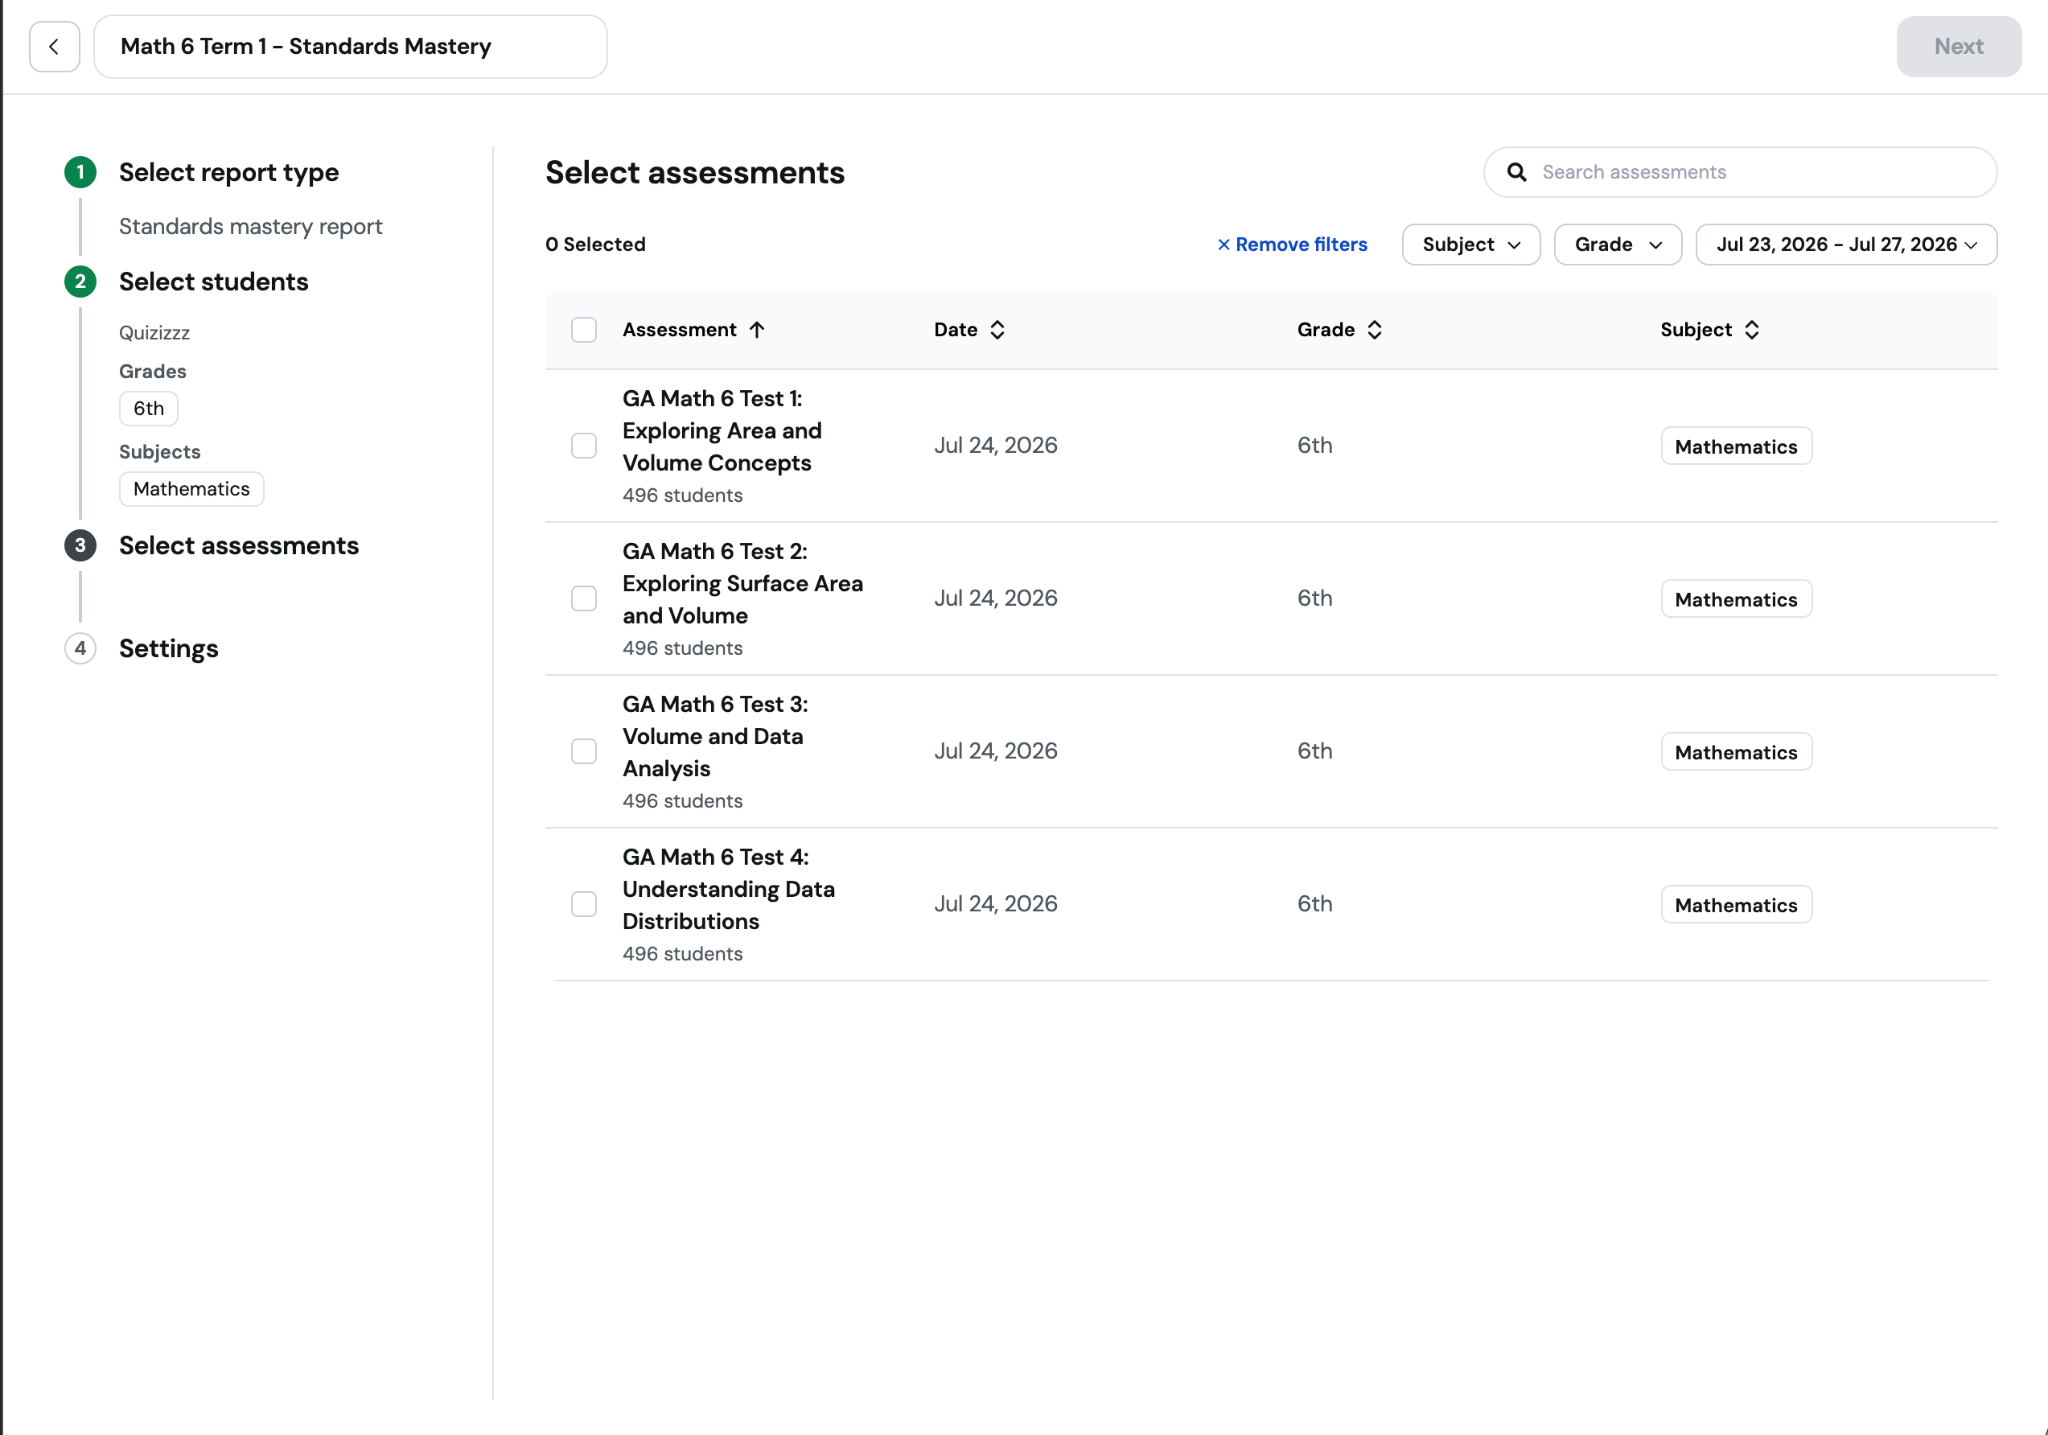
Step 3: Select assessments
Select at least two common assessments that measure the standards you want to analyze. Use search and filters to find them, then click Next.
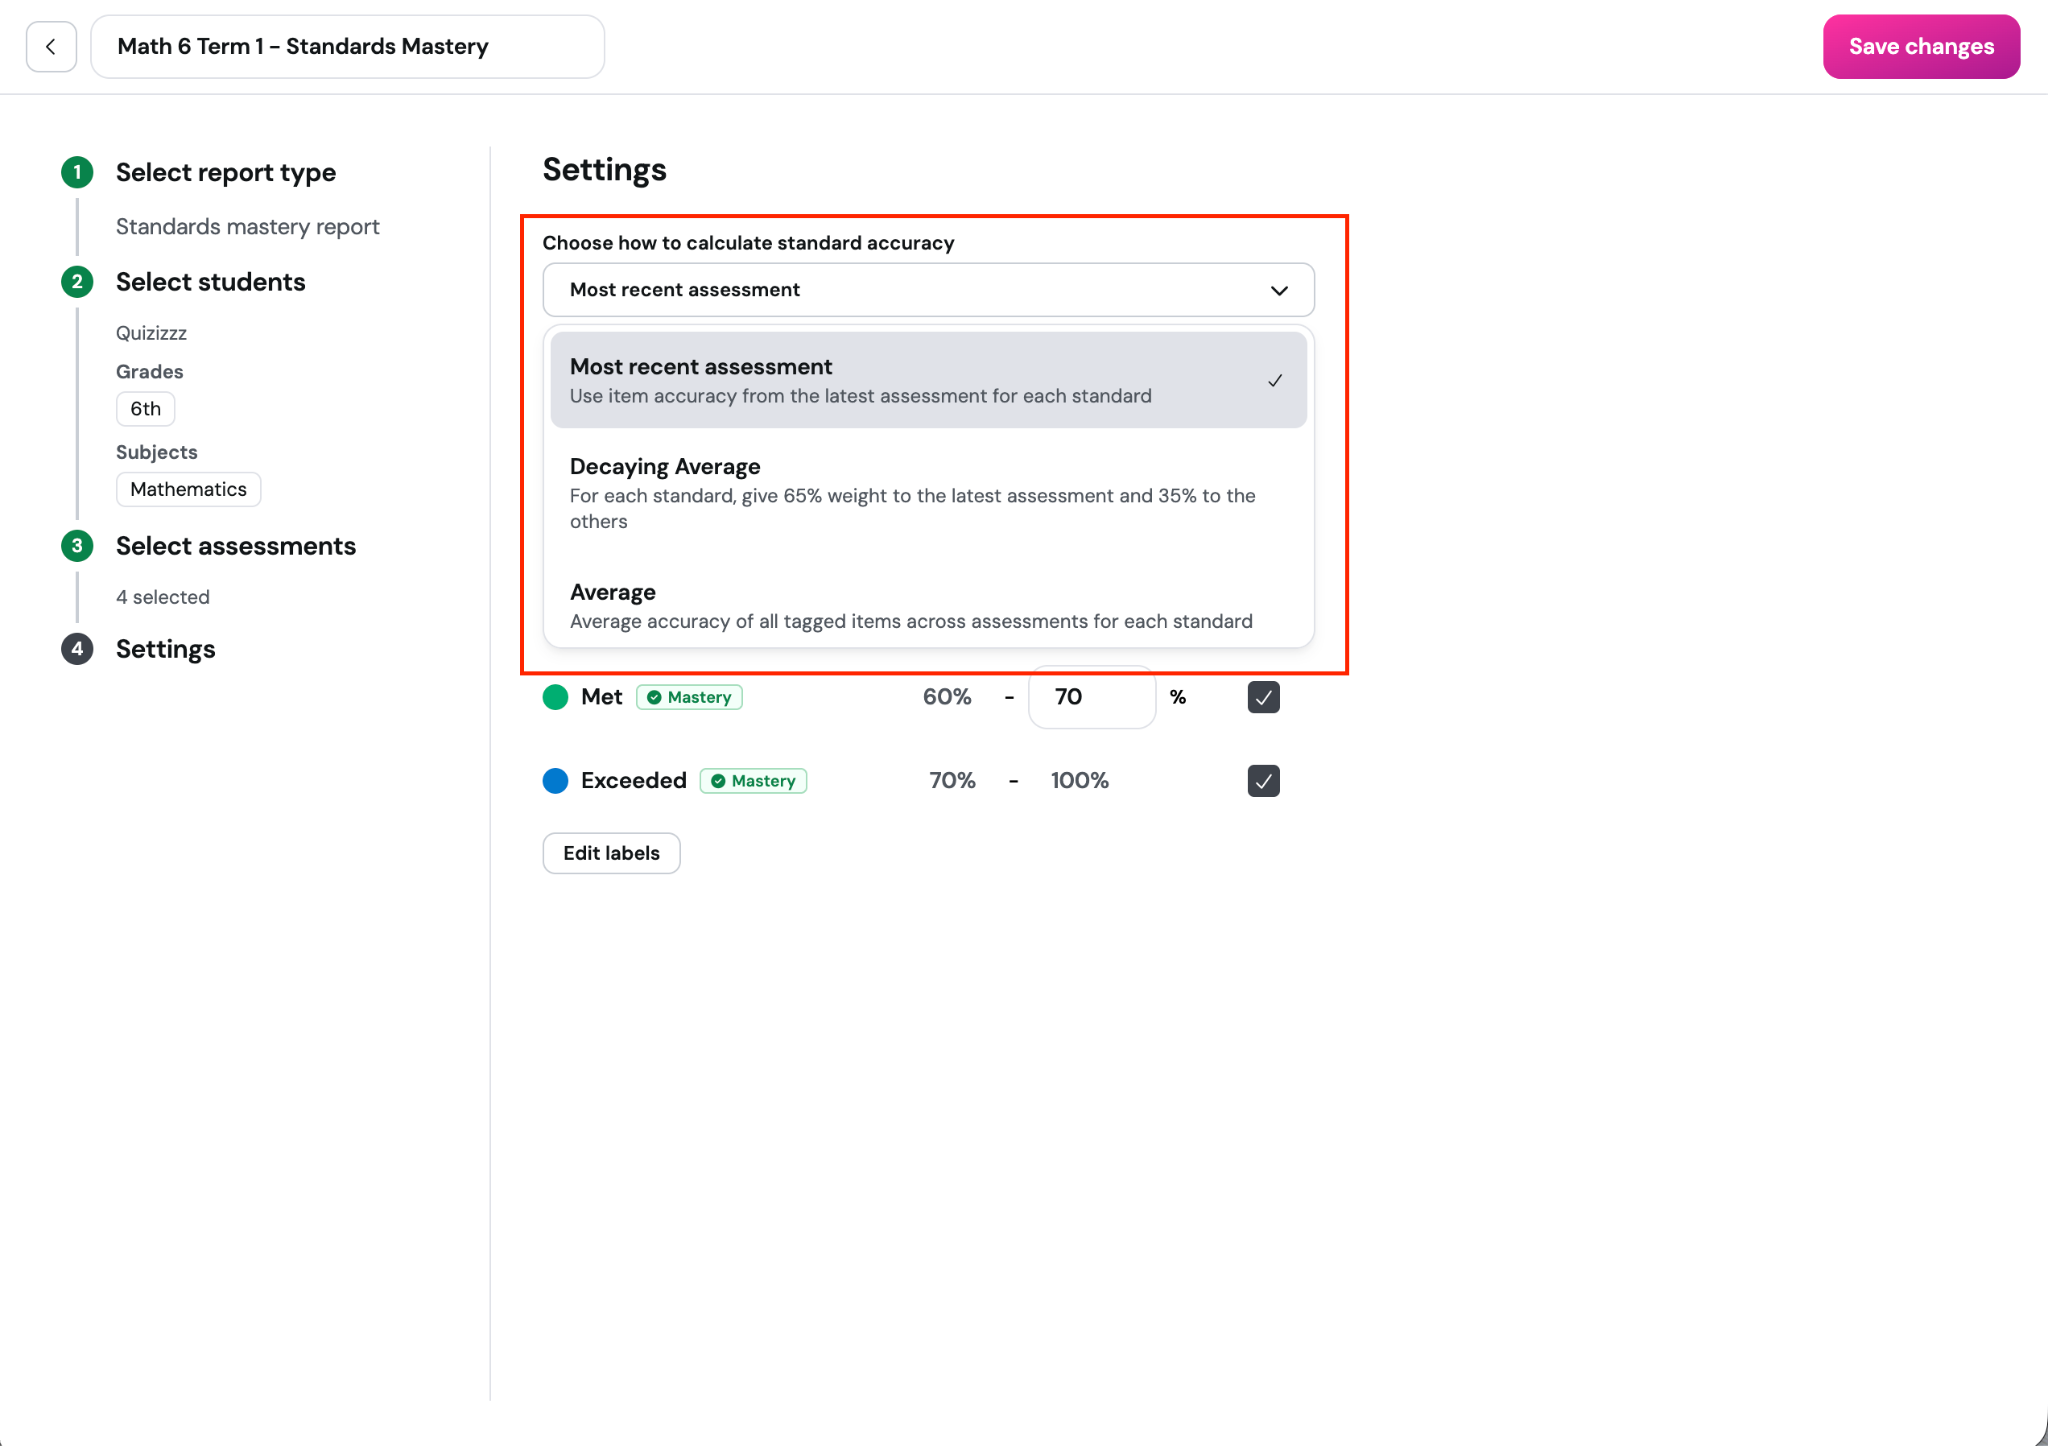
Step 4 - Part 1: Choose how to calculate standard accuracy
This step lets you select how standard accuracy should be calculated if a standard appears in multiple assessments.
Choose the calculation that matches the purpose of the report. Each option answers a different question:
Most recent assessment: Uses accuracy from the latest selected assessment that includes the standard. Choose this to understand current mastery and plan the next move from the most recent evidence.
Decaying Average: Gives 65% weight to accuracy from the latest assessment and 35% to combined accuracy from earlier assessments. Choose this when recent learning should matter most while earlier evidence still provides context.
Average: Calculates accuracy using all tagged items across all selected assessments. Choose this for an overall view of performance across assessments.
Highest score: Uses the highest accuracy achieved for the standard across the selected assessments. Choose this to focus on the strongest performance a student has demonstrated among the selected assessments.
For example -
The standard accuracy would be:
Most recent assessment: 90%
Decaying Average: (90% × 65%) + (60% × 35%) = 79.5%
The earlier-assessment accuracy is 60% because 12 of 20 items were answered correctly.Average: 70% because 21 of 30 items were answered correctly across all three assessments.
Highest score: 90%
Step 4 - Part 2: Set performance bands
Performance bands turn accuracy results into groups that teams can interpret and act on.
The thresholds determine the band assigned to each student, and the bands selected as Mastery determine the % at Mastery shown throughout the report. This gives teams a shared definition of mastery and supports consistent planning for reteaching, targeted practice, movement toward Exceeded, or extension.
Adjust the percentage thresholds to align each band’s accuracy range with your district’s expectations.
Select the bands that should count as Mastery to define which student results contribute to % at Mastery.
Use Edit labels if your district uses different names for the performance bands.
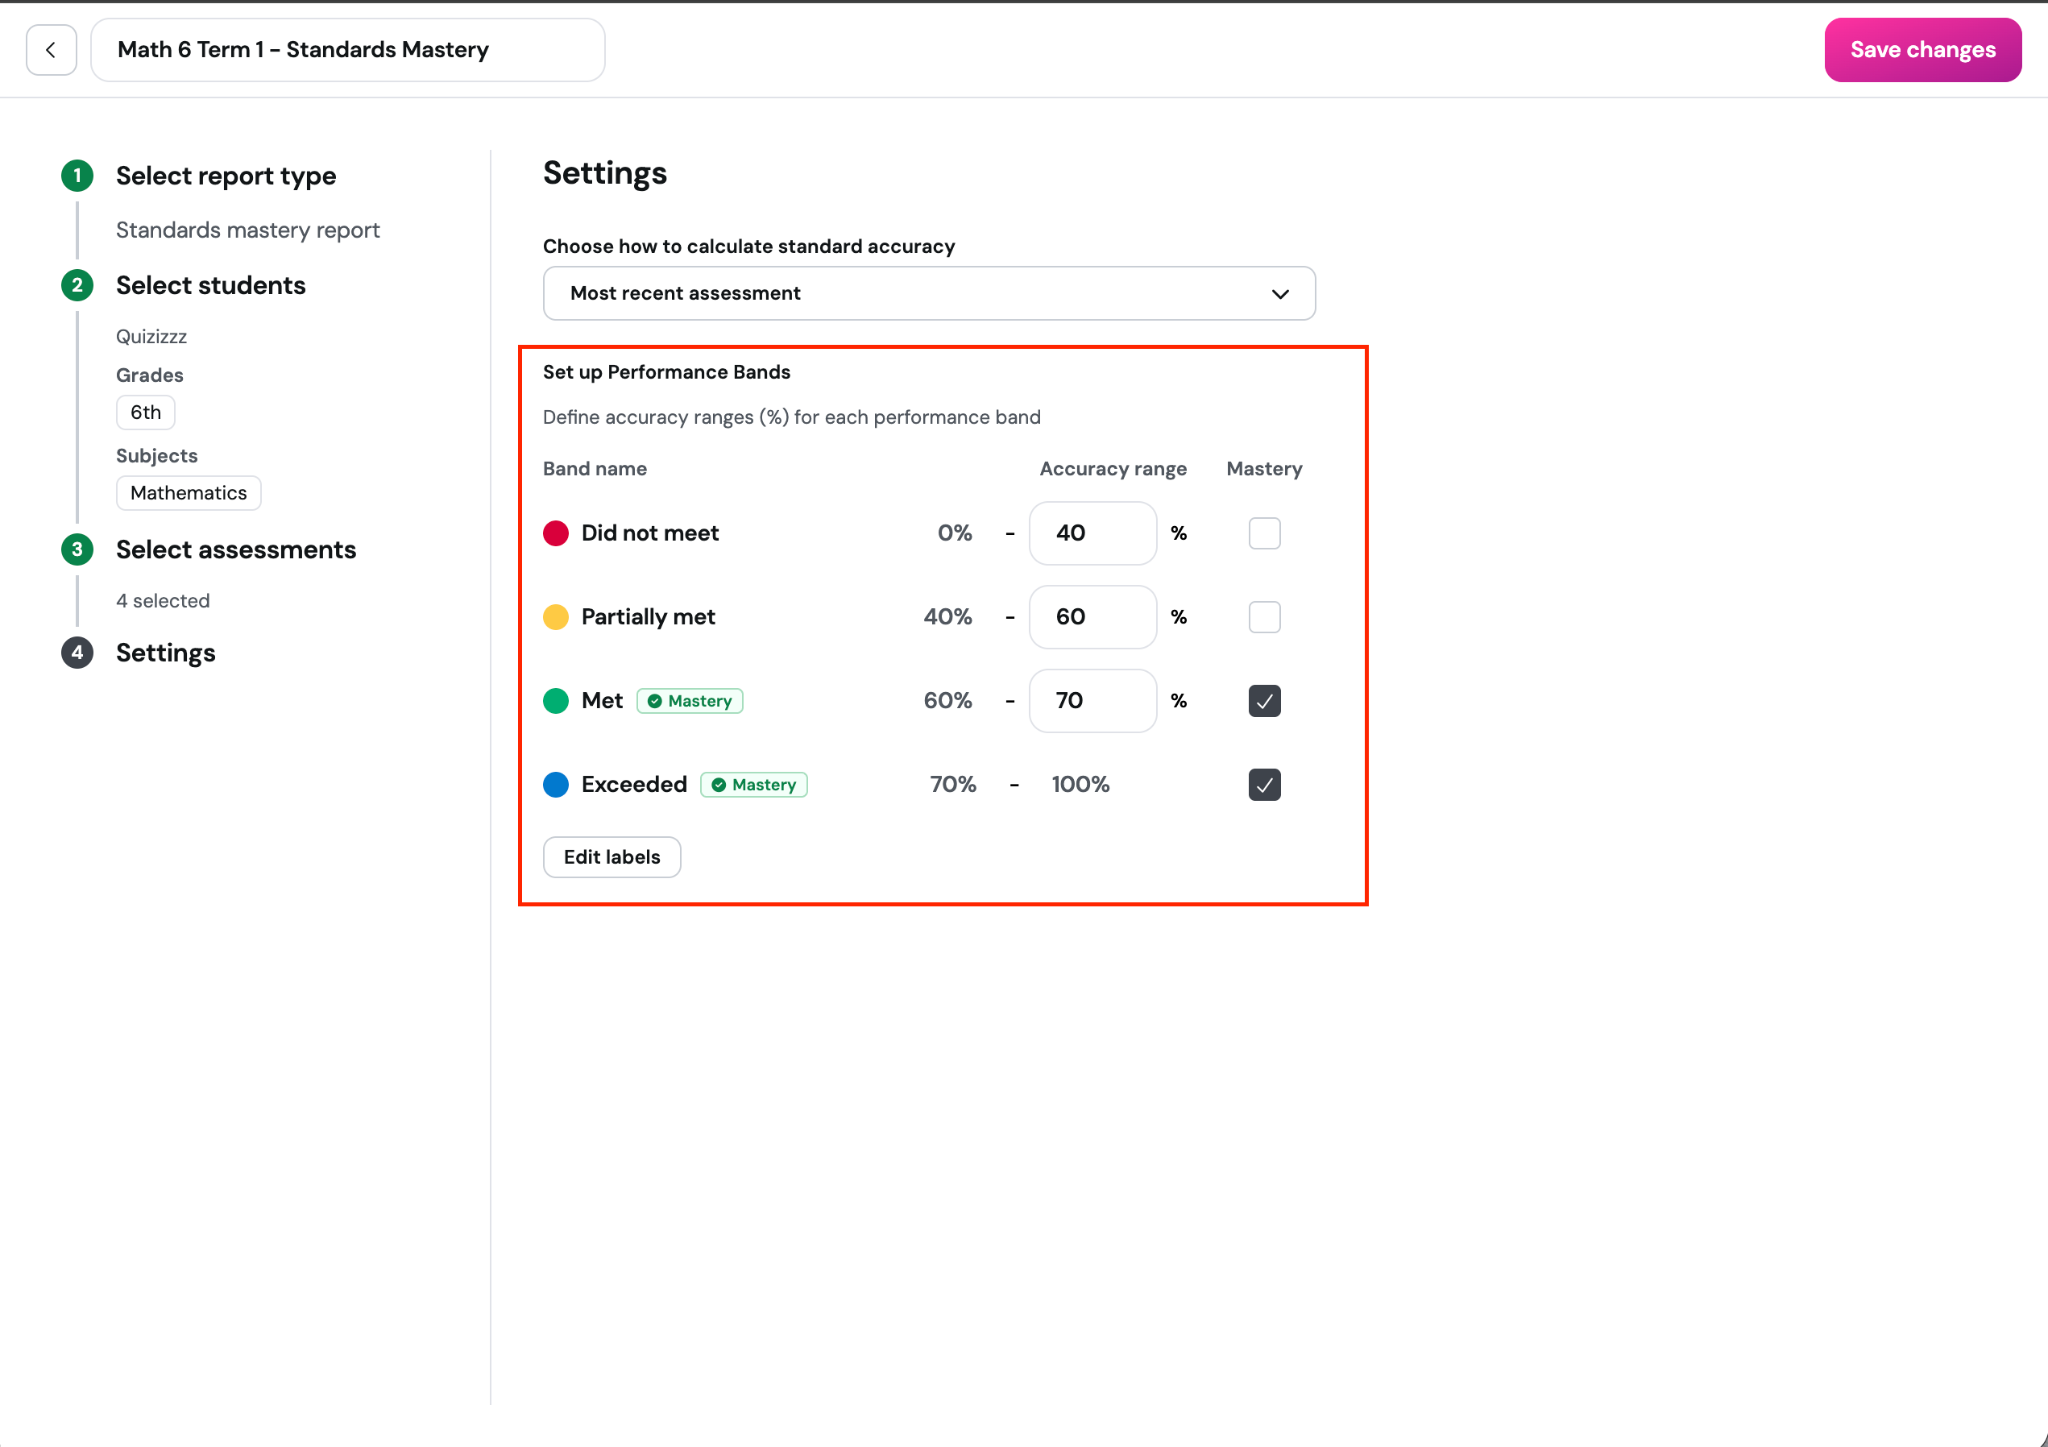
For example, with the settings shown, a score from 70% to 89% is Met, while a score from 90% to 100% is Exceeded. Both bands count as mastery
When you’re finished, click Save to create the report.
Refer to this article to learn more about how to use the Standards Mastery Report, go here: How to use a Standards Mastery Report
Was this article helpful?
That’s Great!
Thank you for your feedback
Sorry! We couldn't be helpful
Thank you for your feedback
Feedback sent
We appreciate your effort and will try to fix the article