Note: Custom Reports are available as a part of Common Assessments add-on. To access this feature and learn more about Common Assessments add-on and the Schools & Districts plan, please email sales@wayground.com
Use a Standards Mastery Report to move from a broad standards signal to a specific instructional next step. The report combines results from two or more common assessments so you can identify what is working, share effective approaches, direct support where it can have the greatest impact, and plan next steps across schools, classes, subgroups, and students.
Start with the question you want to answer -
Which standards are strong and which would benefit from additional attention?
Is a standards-level pattern widespread or concentrated in particular schools, classes, subgroups, or students?
Which students fall into each performance band?
How did performance change on this standard across assessments? Which items were used to assess and what was the performance on each?
How can I compare patterns across schools, classes, and subgroups across all standards?
How can I focus every report view on one school, class, or subgroup?
How can I review students’ performance across standards?
How has an individual student’s performance on a standard changed across assessments?
Access the report
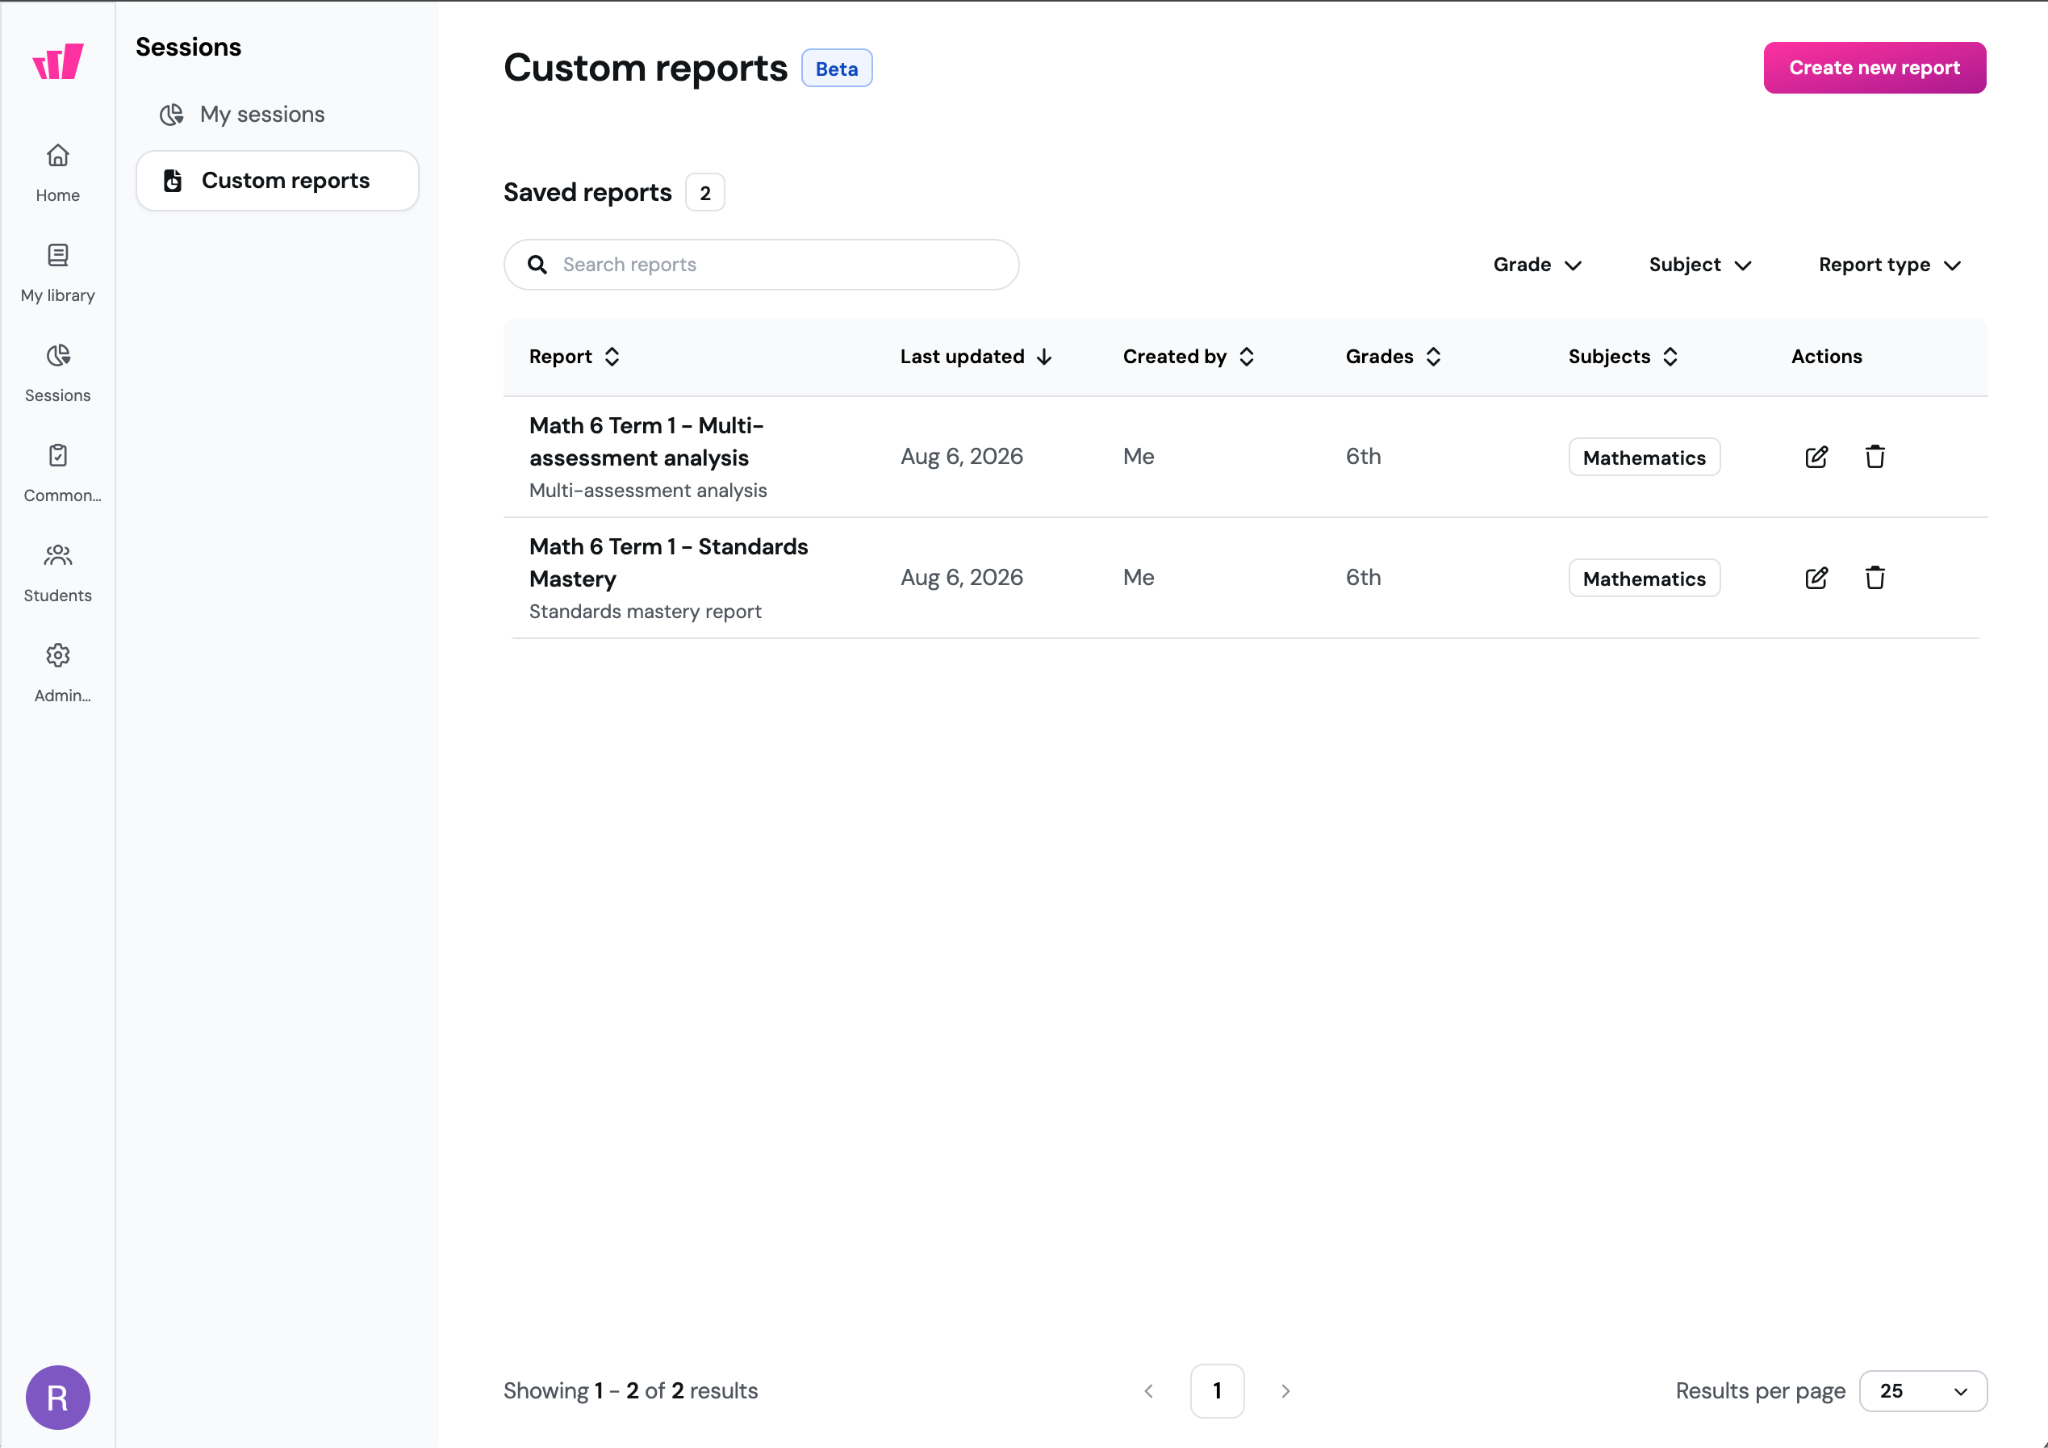
Go to Sessions → Custom Reports
Select the “Standards Mastery Report” you want to review
Begin on the “Summary” view to see the broadest standards-level patterns.
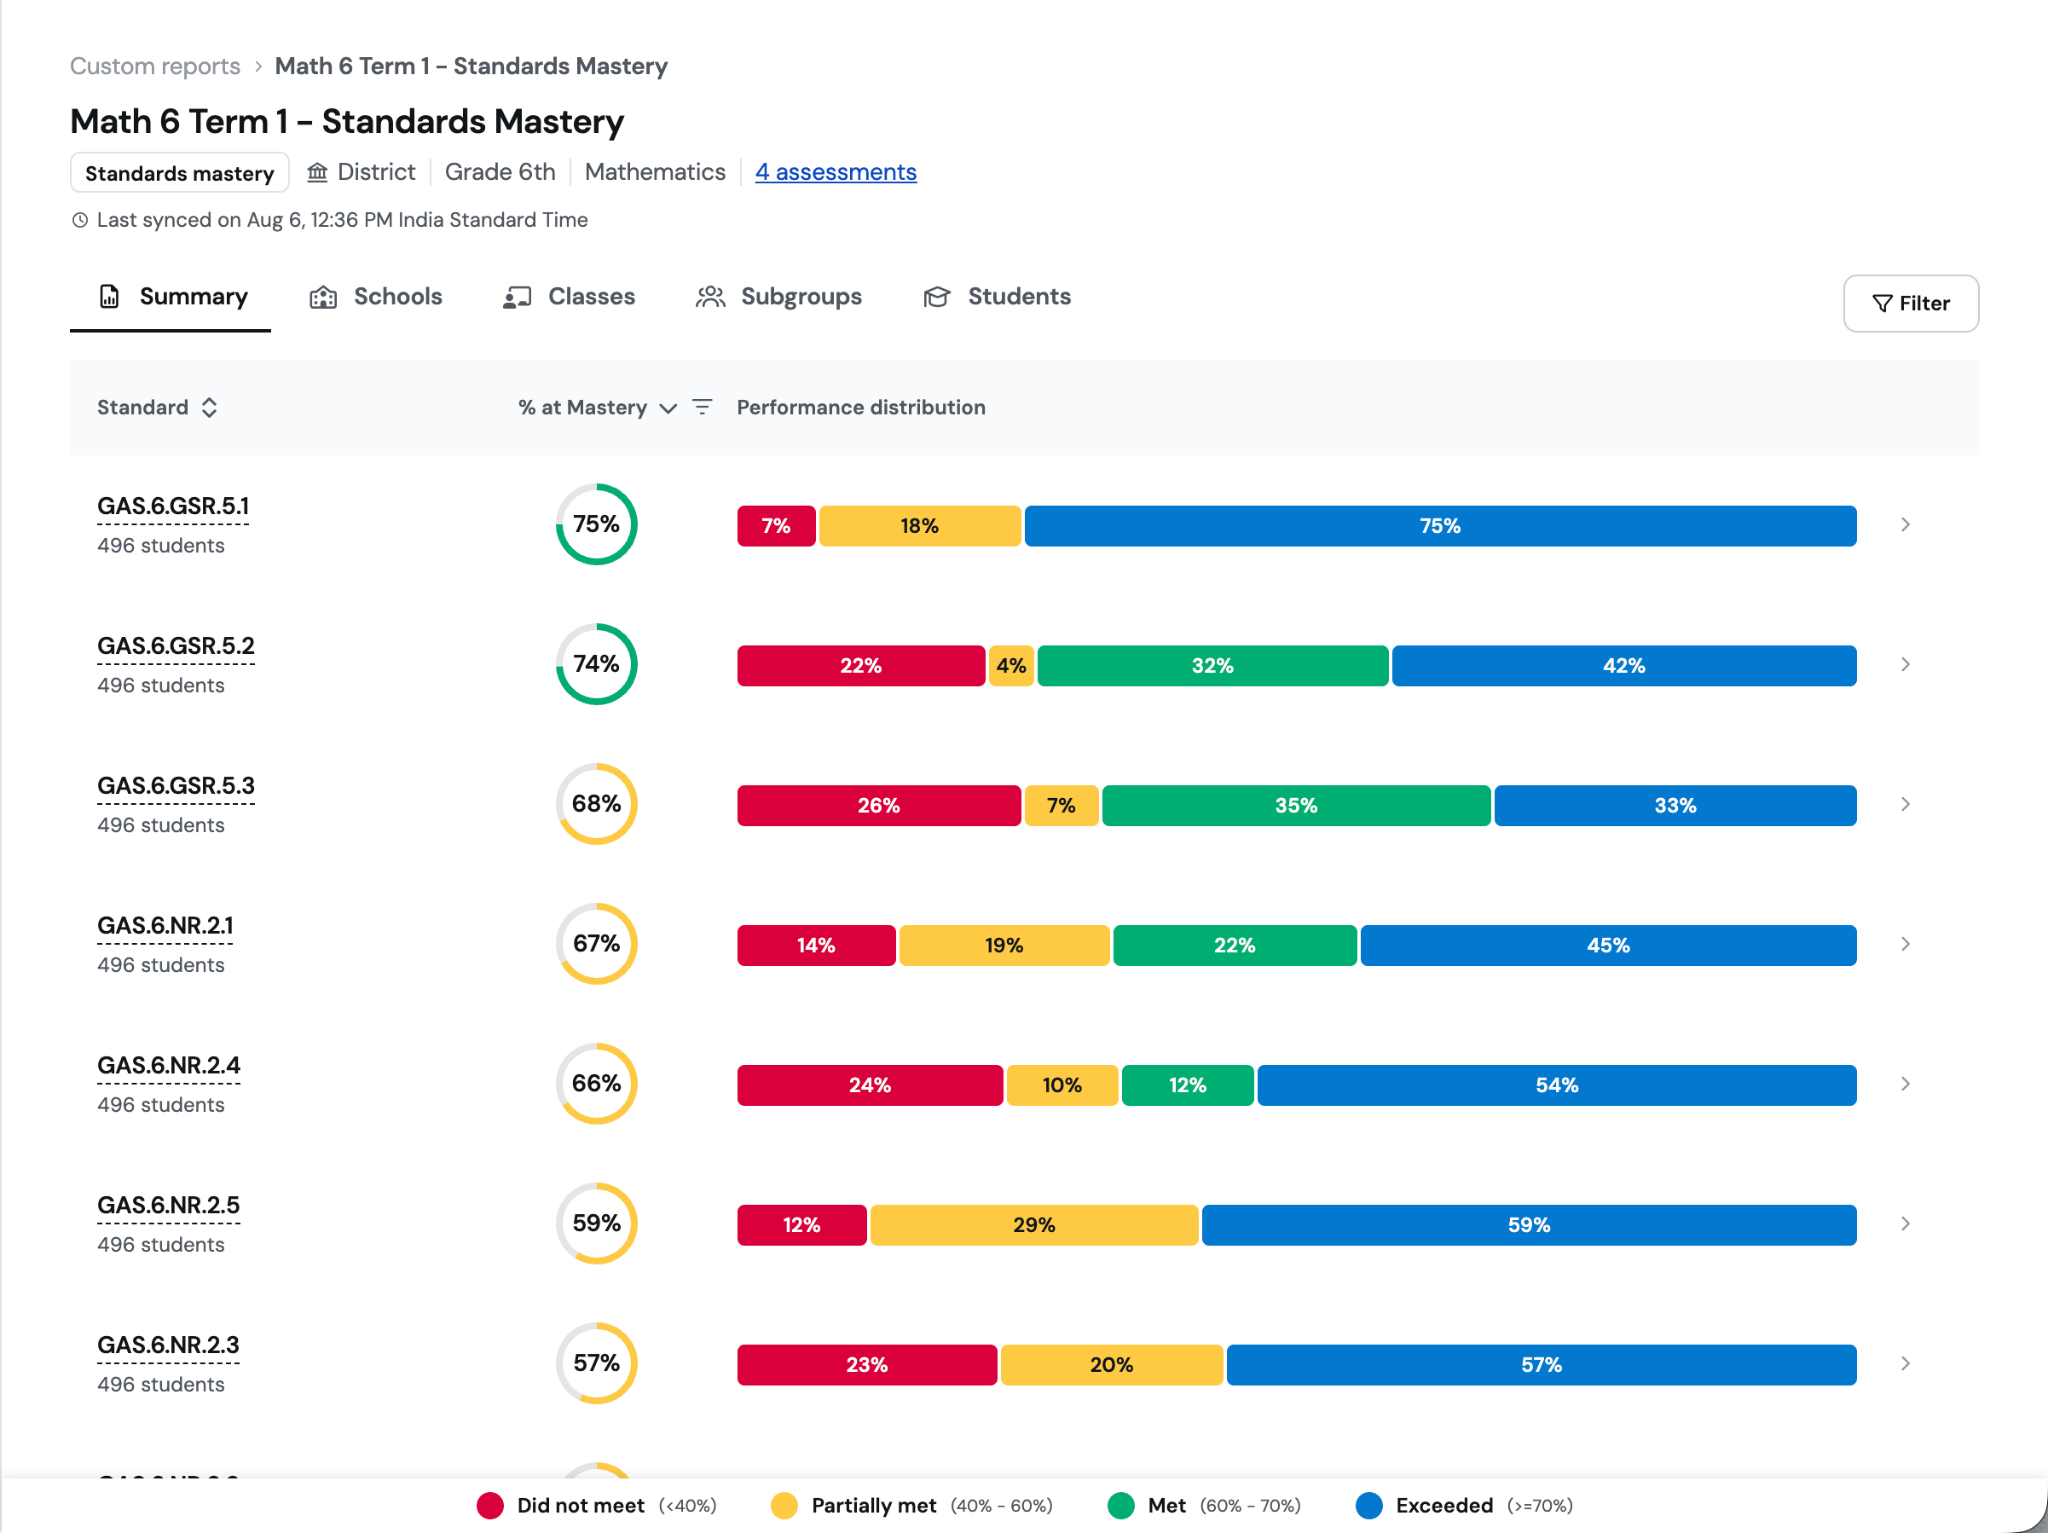
Which standards are strong and which would benefit from additional attention?
The Summary view shows each assessed standard, the percentage of students at mastery, and the performance distribution across bands. Use both measures together: the mastery percentage shows the overall result, while the distribution shows how student performance is spread across the bands.
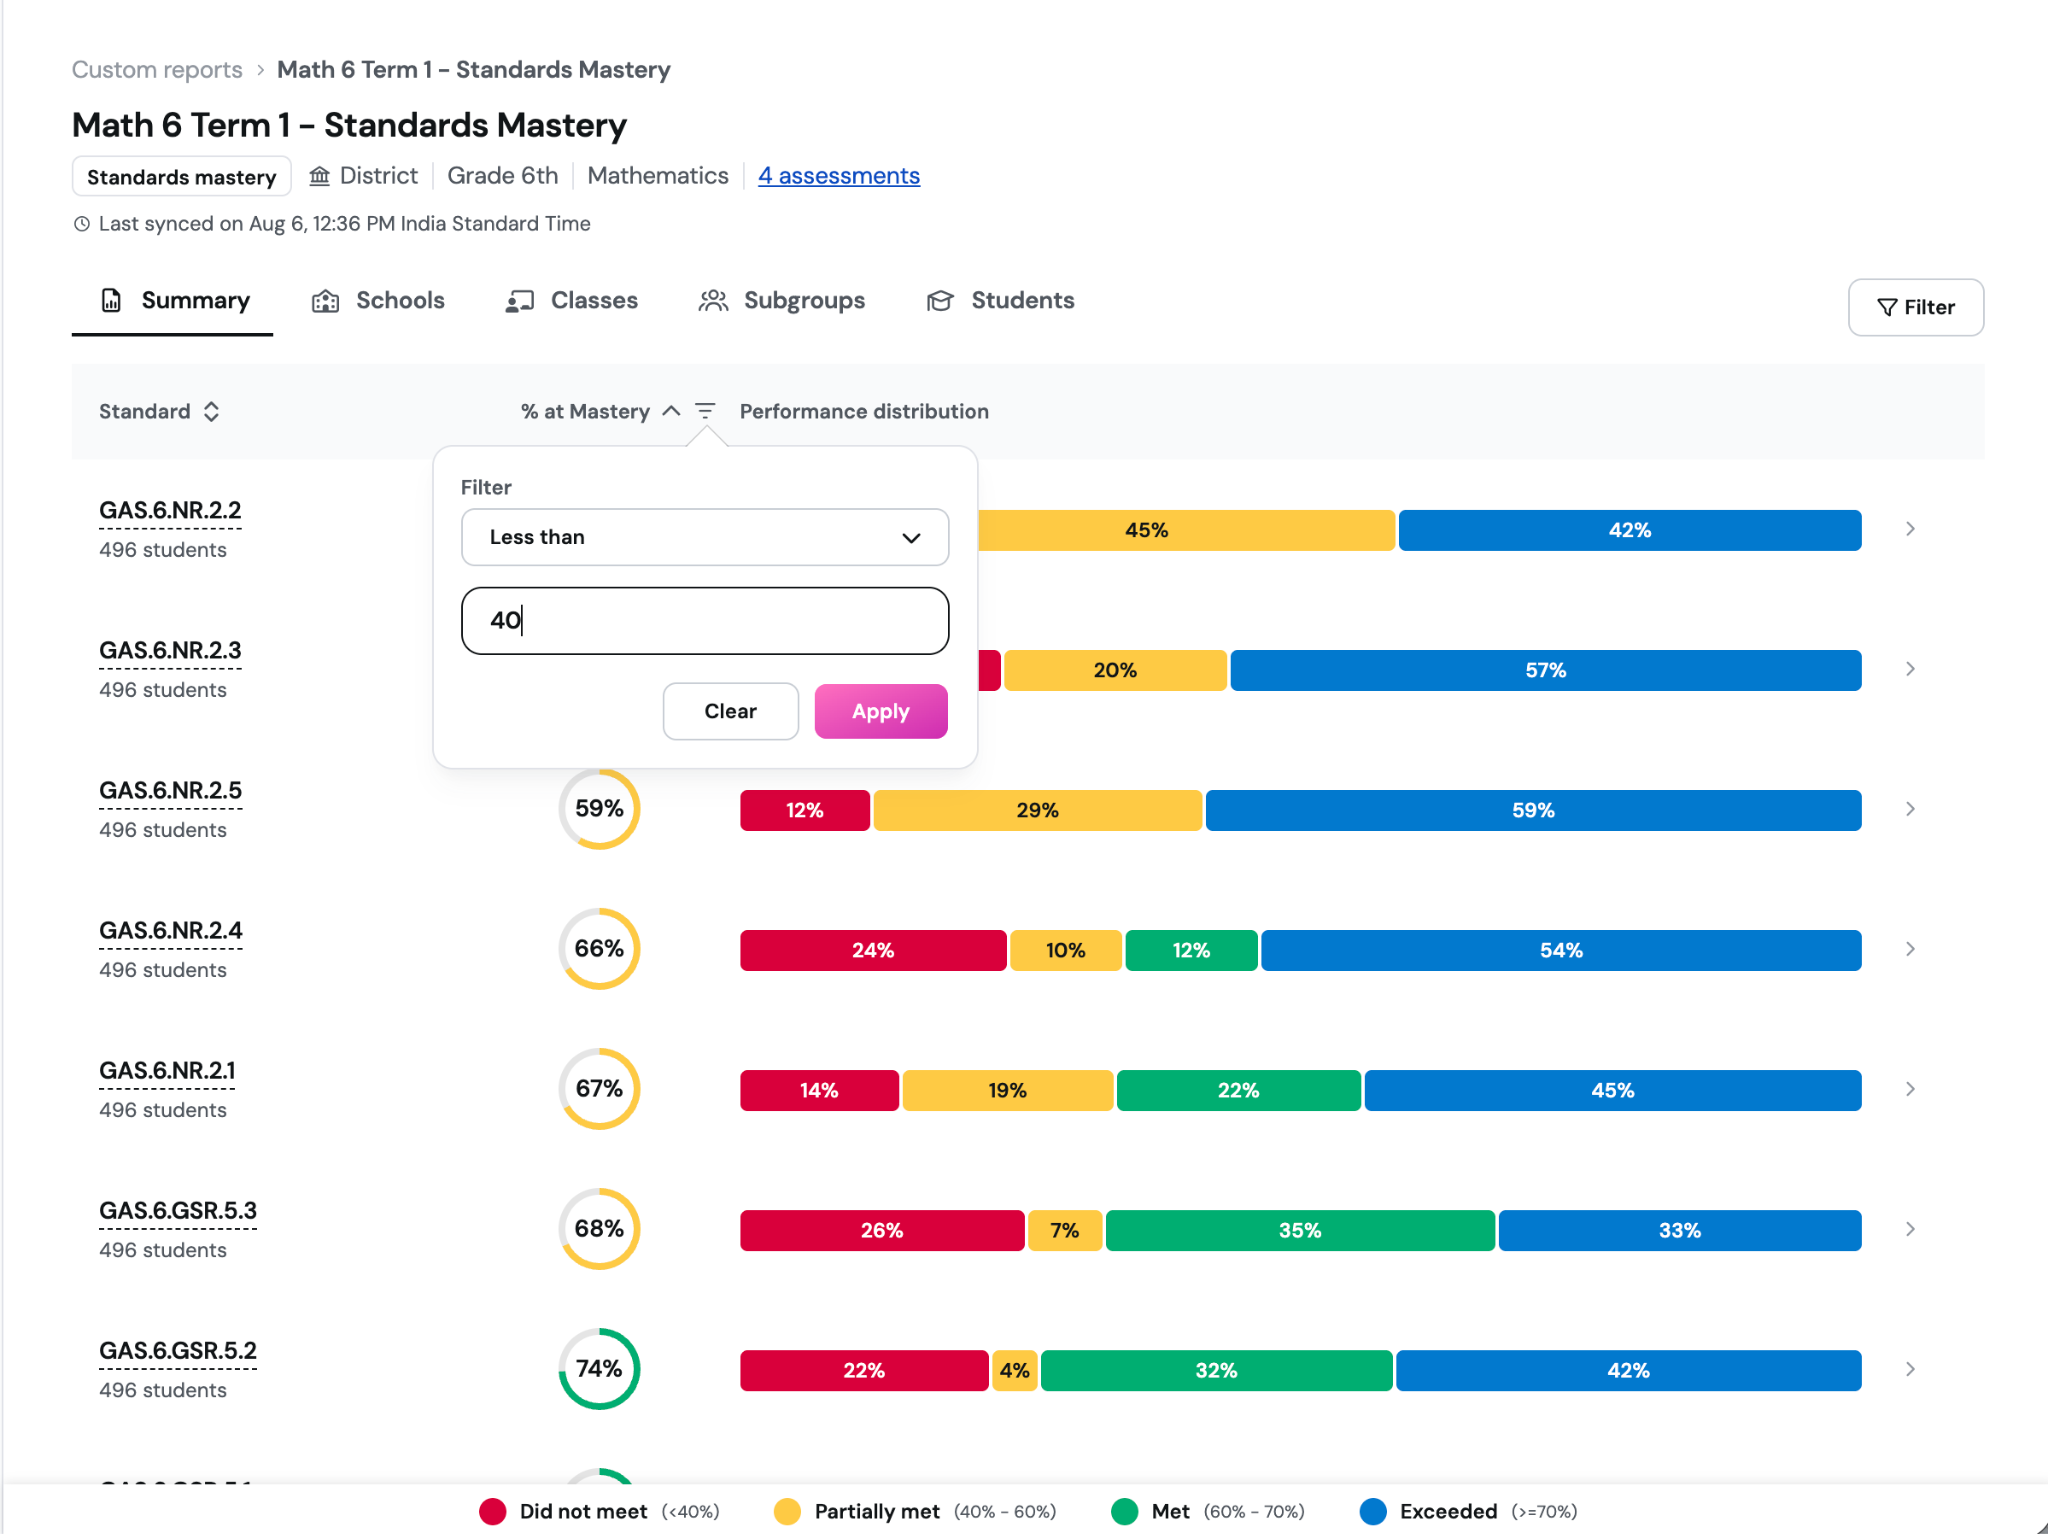
Sort the Summary by mastery to surface strong results and standards that may benefit from additional attention. Use the mastery filter to focus on a particular range.
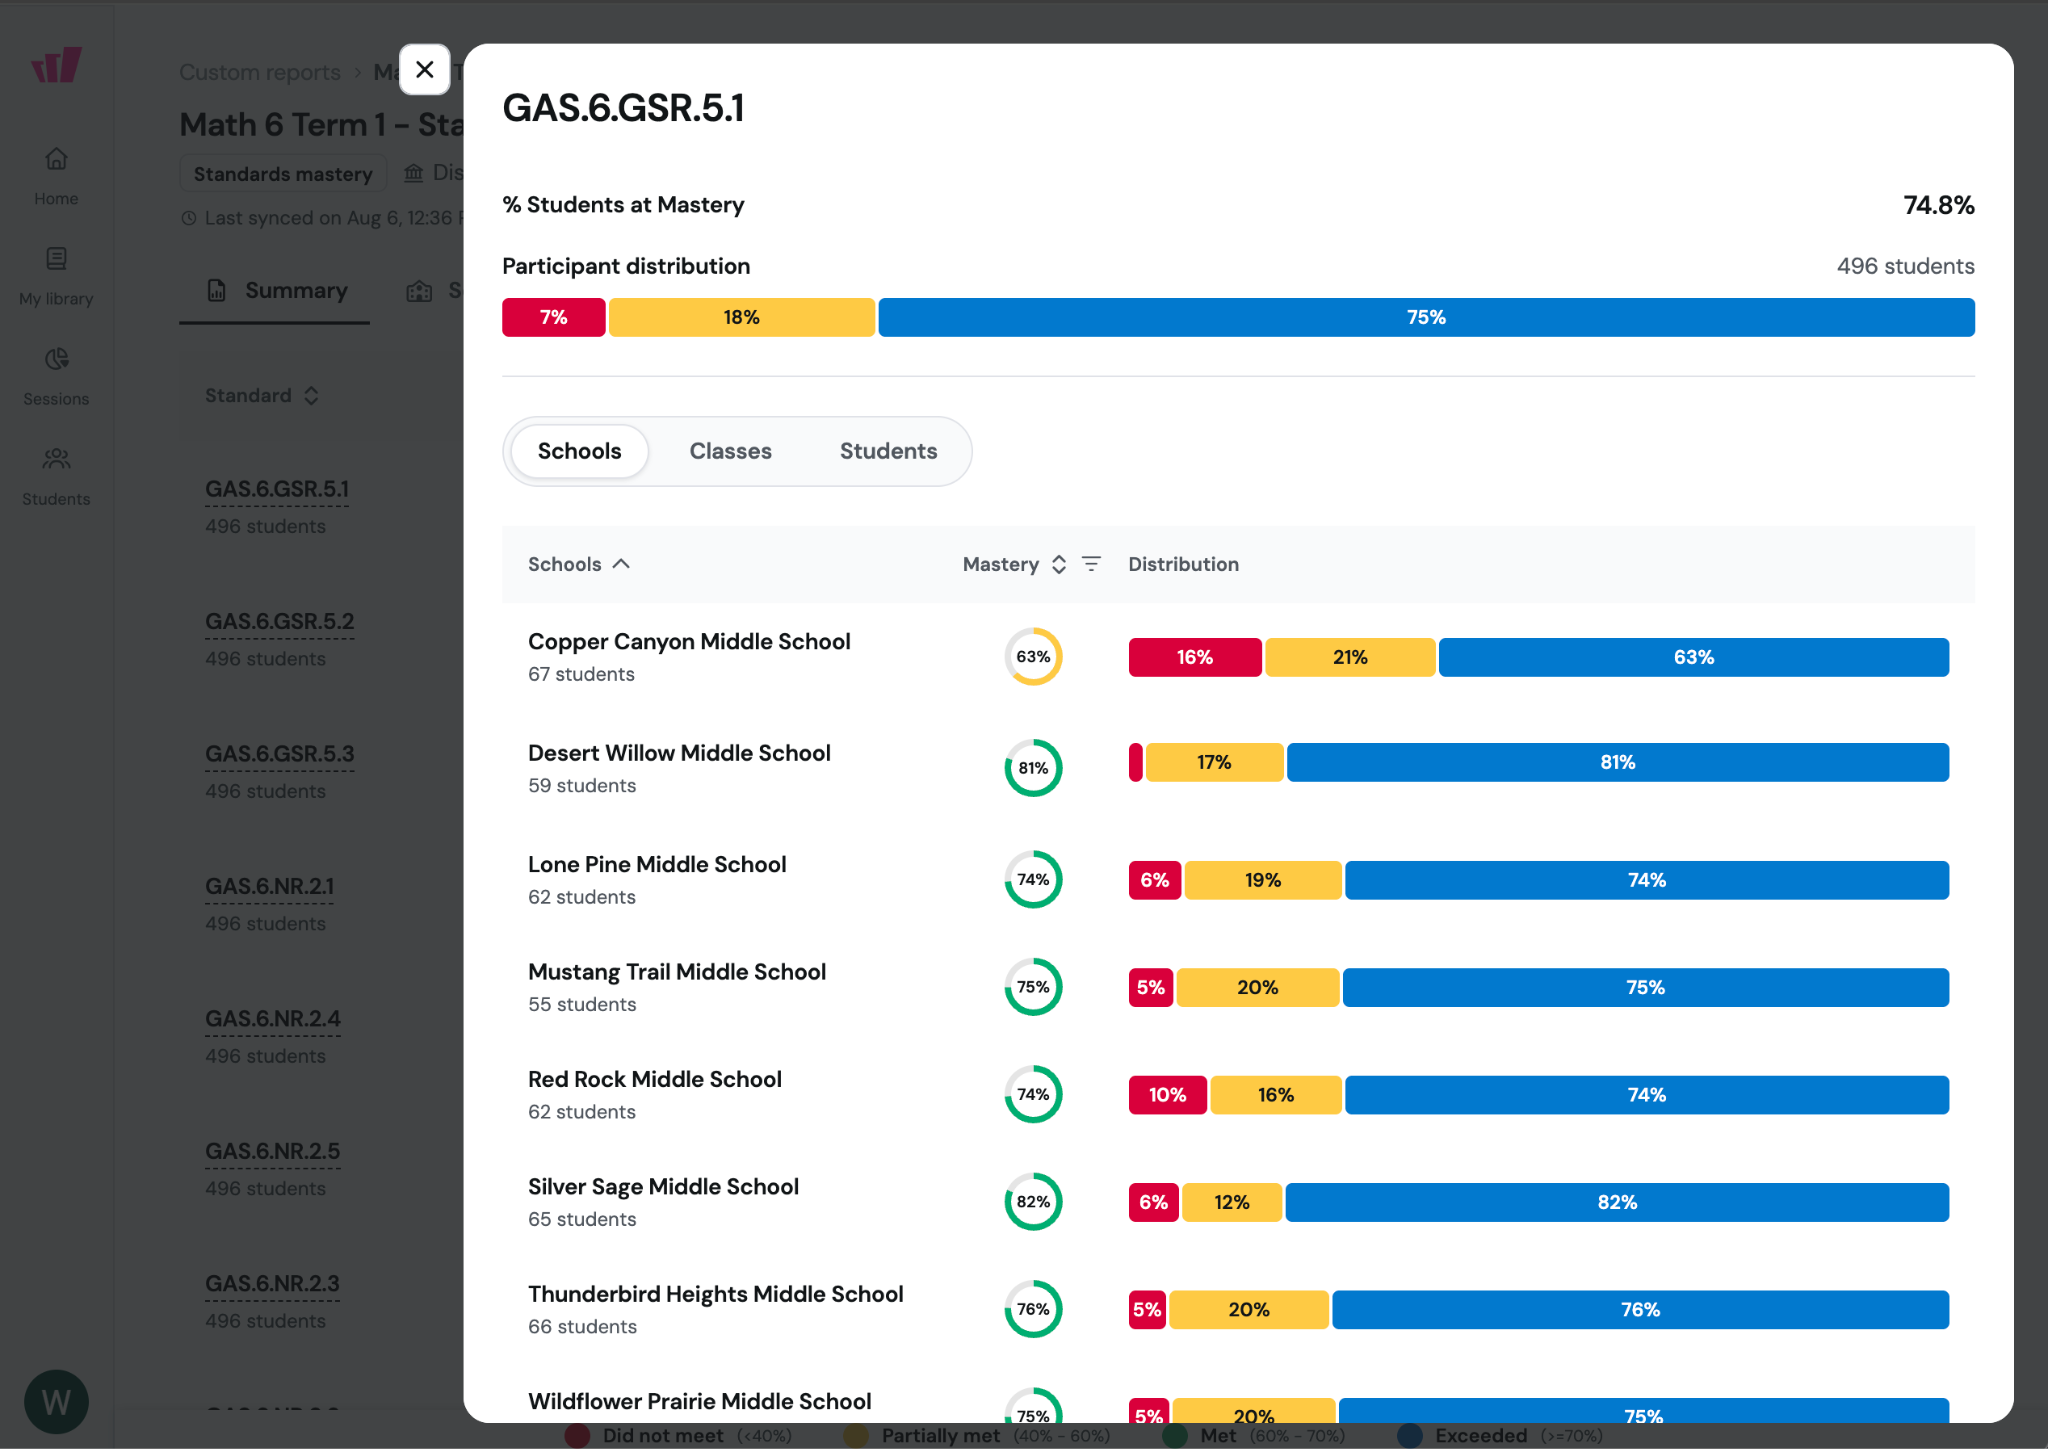
Is a standards-level pattern widespread or concentrated in particular schools or classes?
Click on any standard to open its breakdown. Move among Schools and Classes to see how the result varies and where strengths are most visible. Within each tab, sort or filter by mastery to bring relevant groups into view. You can use stronger results to identify practices or resources worth sharing, and use lower or uneven results to decide where additional support may have the greatest impact.
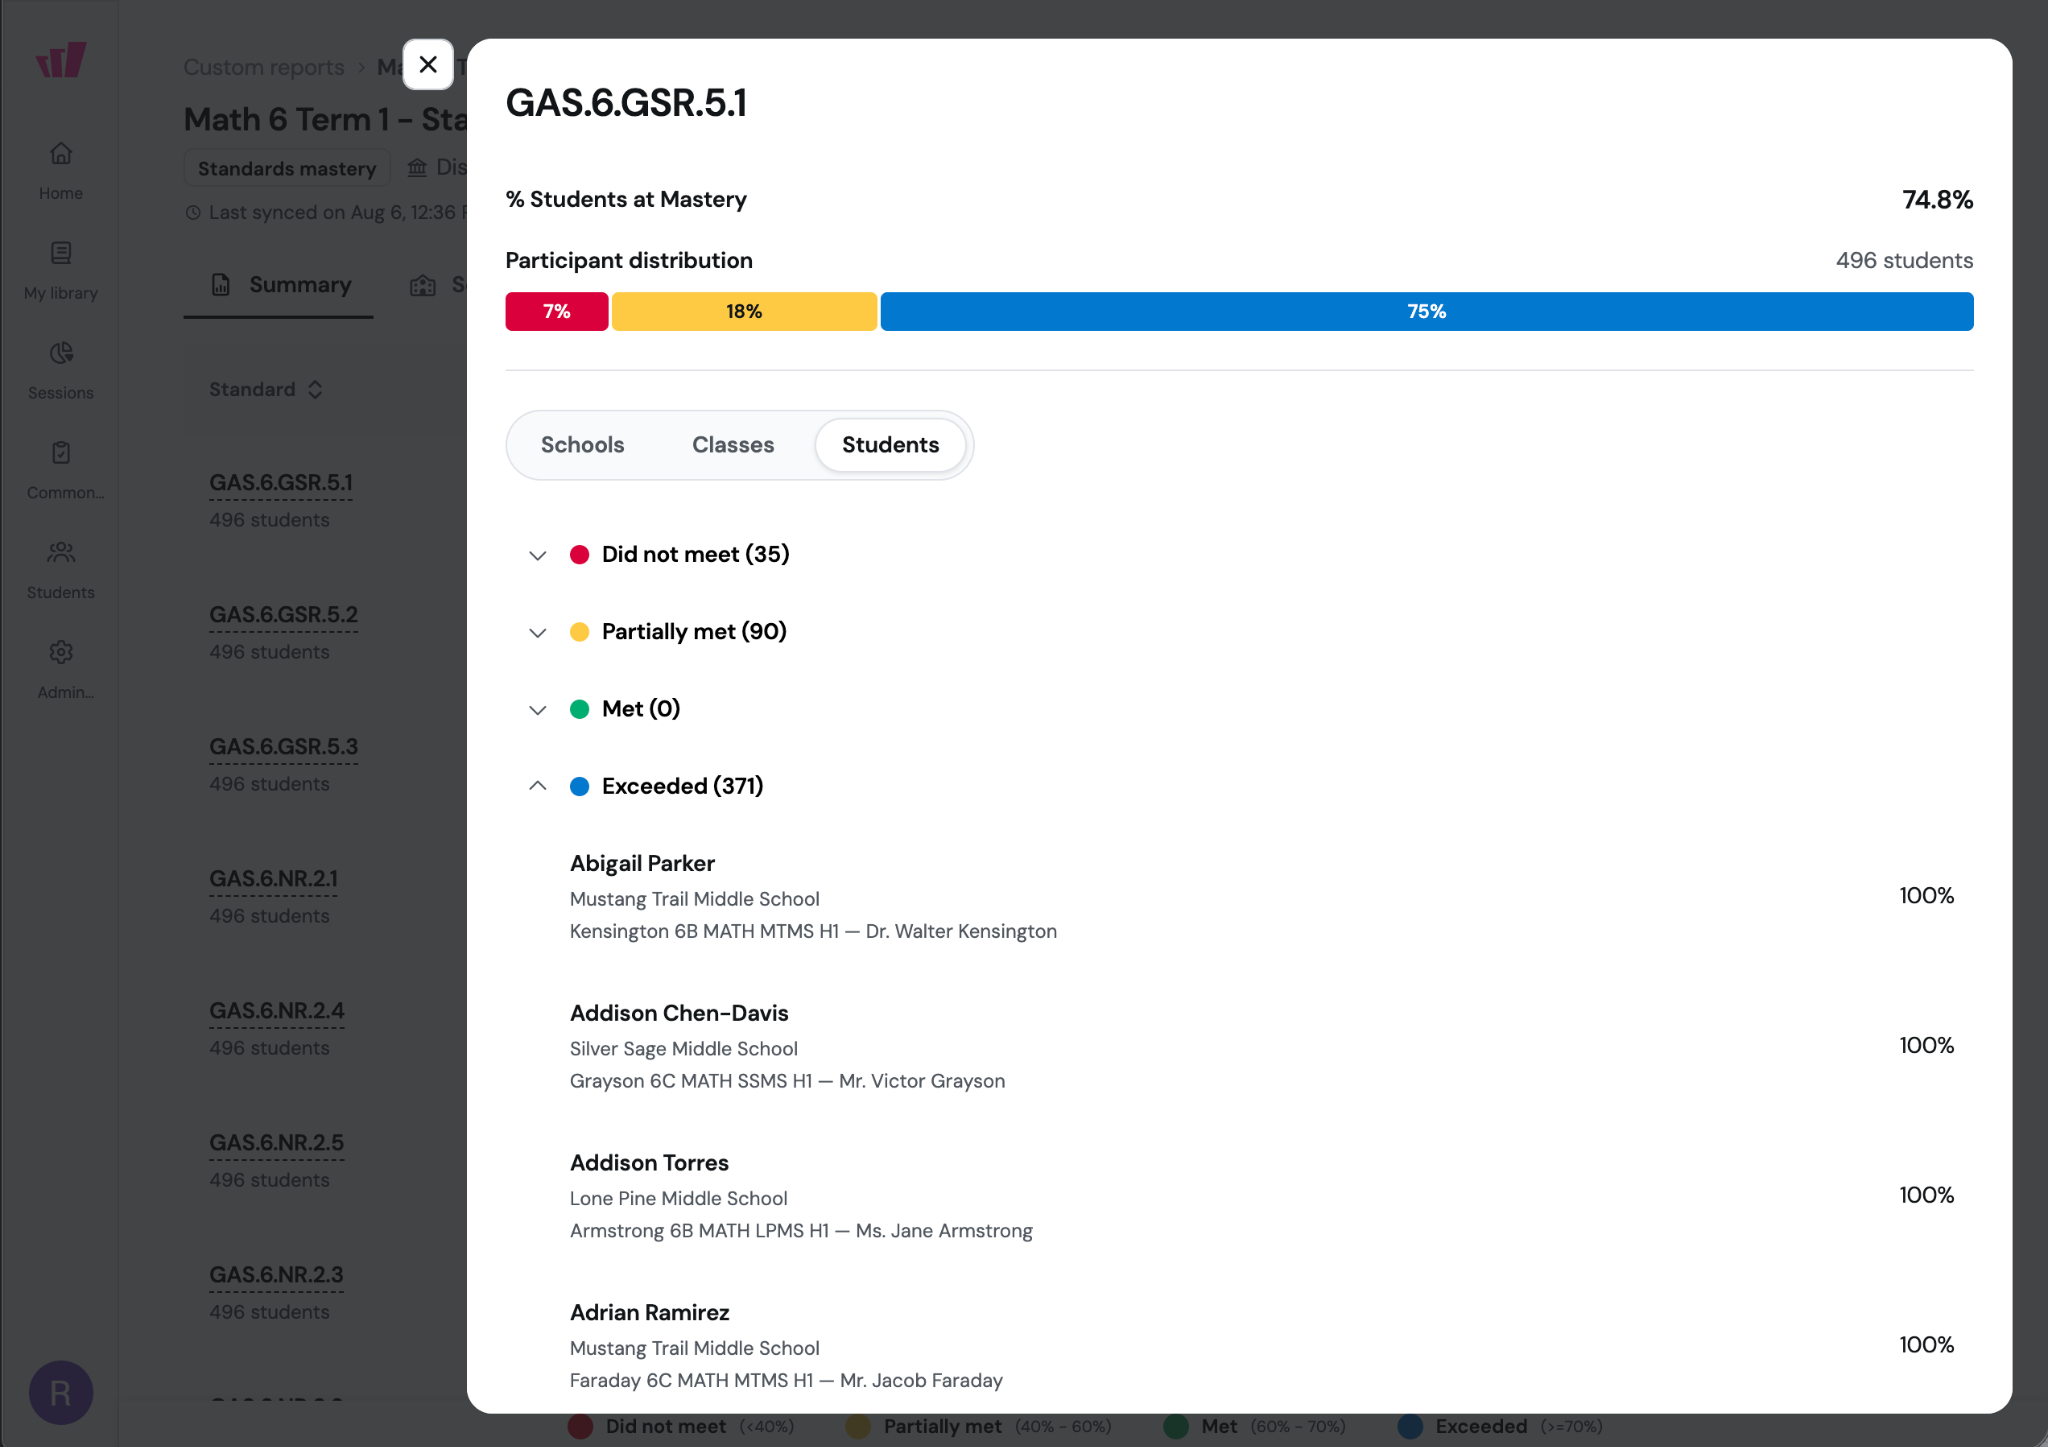
Which students fall into each performance band?
In the standard drill-down, open the Students tab to group students by performance band. This makes it easier to identify students who may benefit from the same next step:
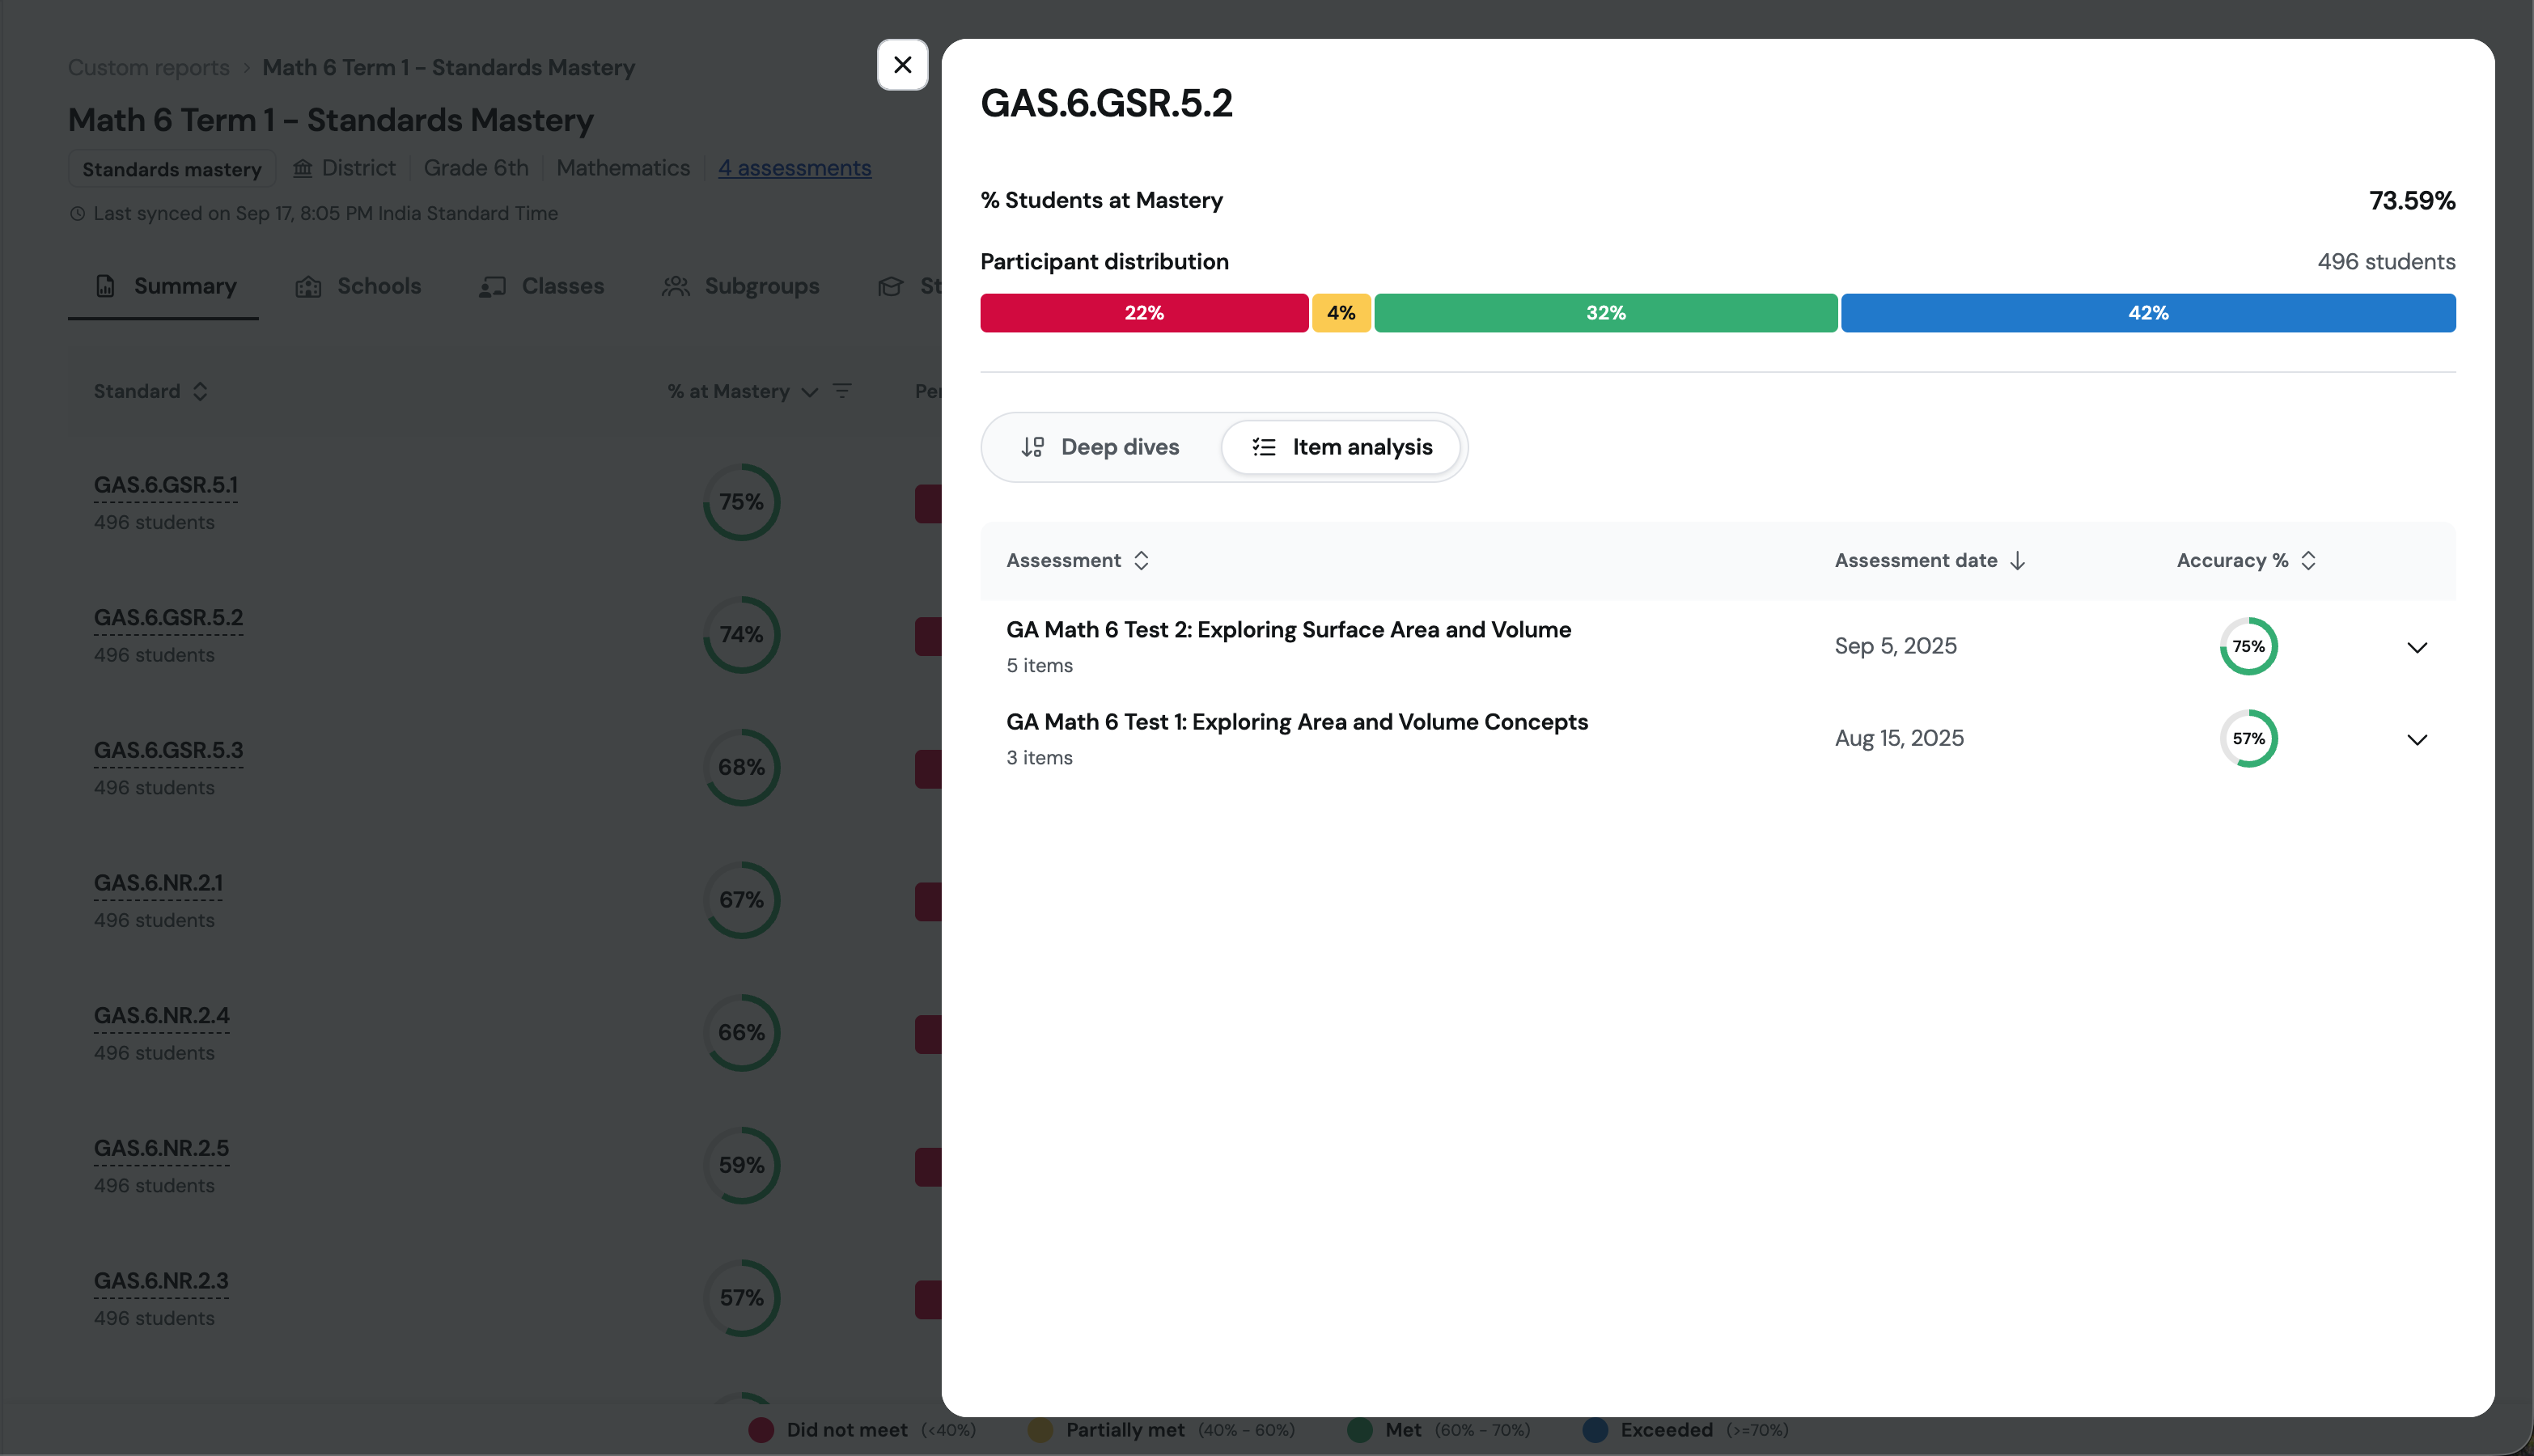
How did performance change on this standard across (selected) assessments? Which items were used to assess and what was the performance on each?
Move to "Item Analysis" in any side sheet to find a list of assessments where that standard was assessed.
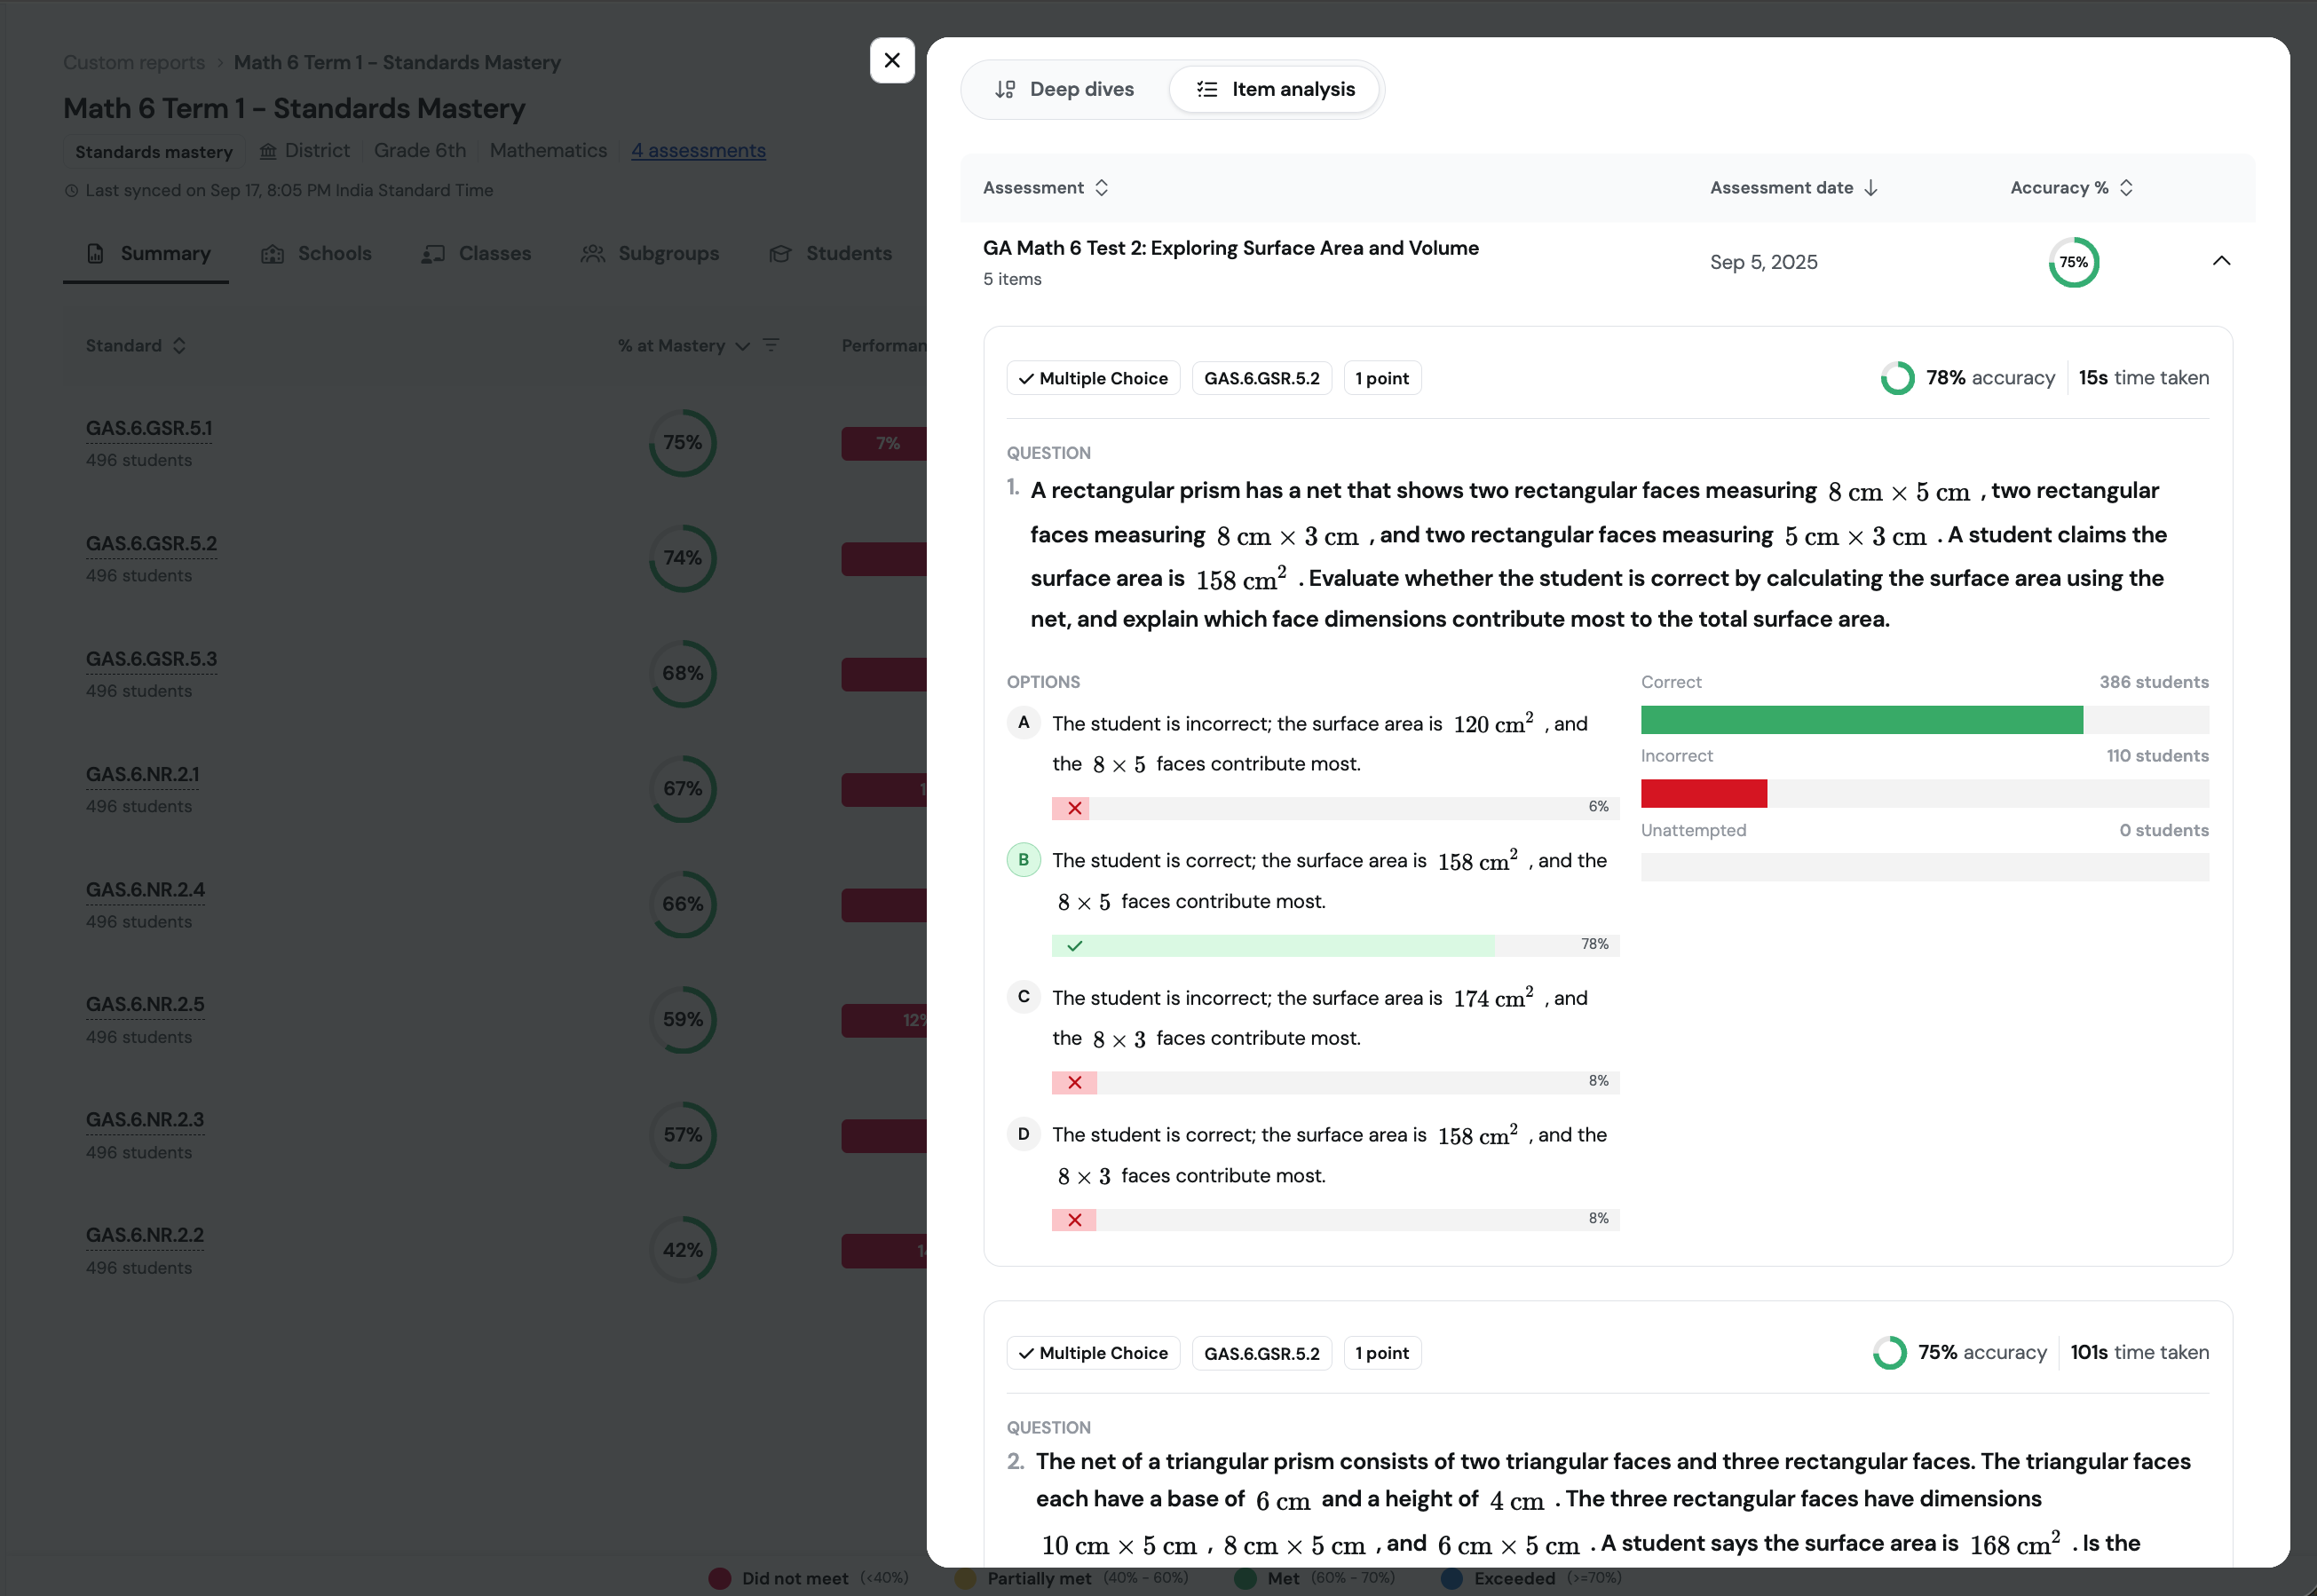
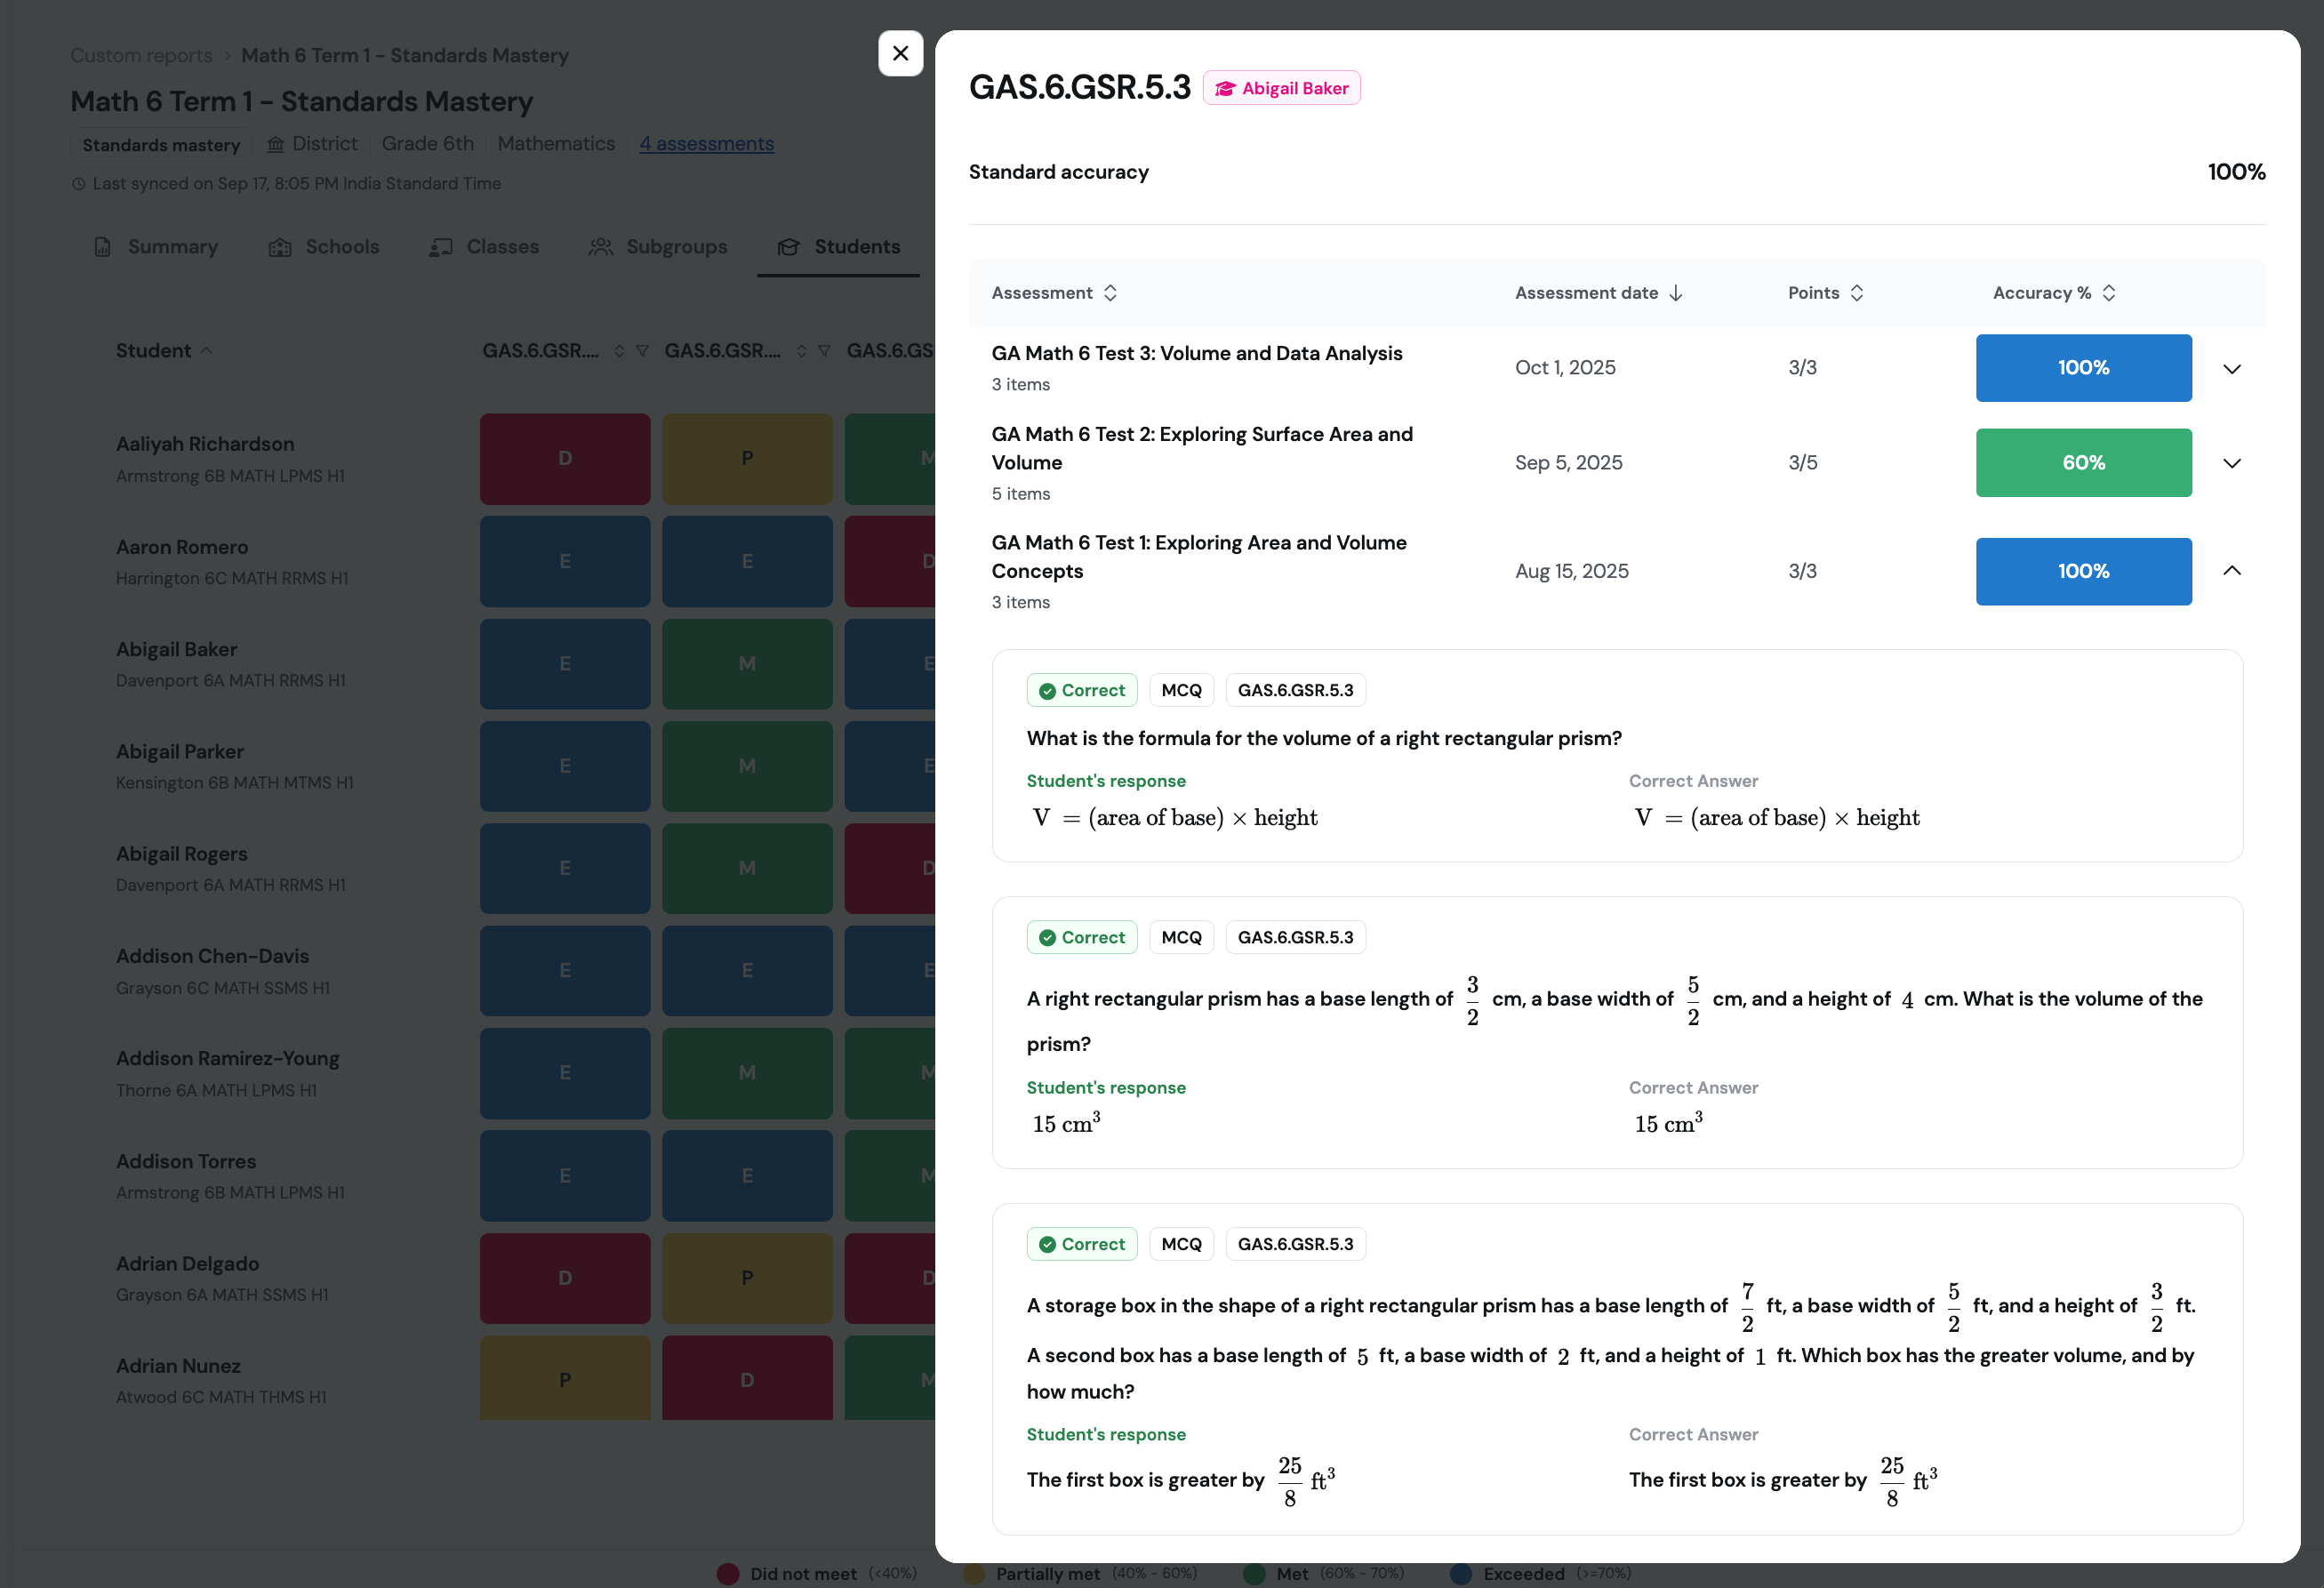
Click on any assessment to expand it to reveal items in that assessment tagged to that standard and find response/item analysis for each of the items.
How can I compare patterns across schools, classes, and subgroups across all standards?
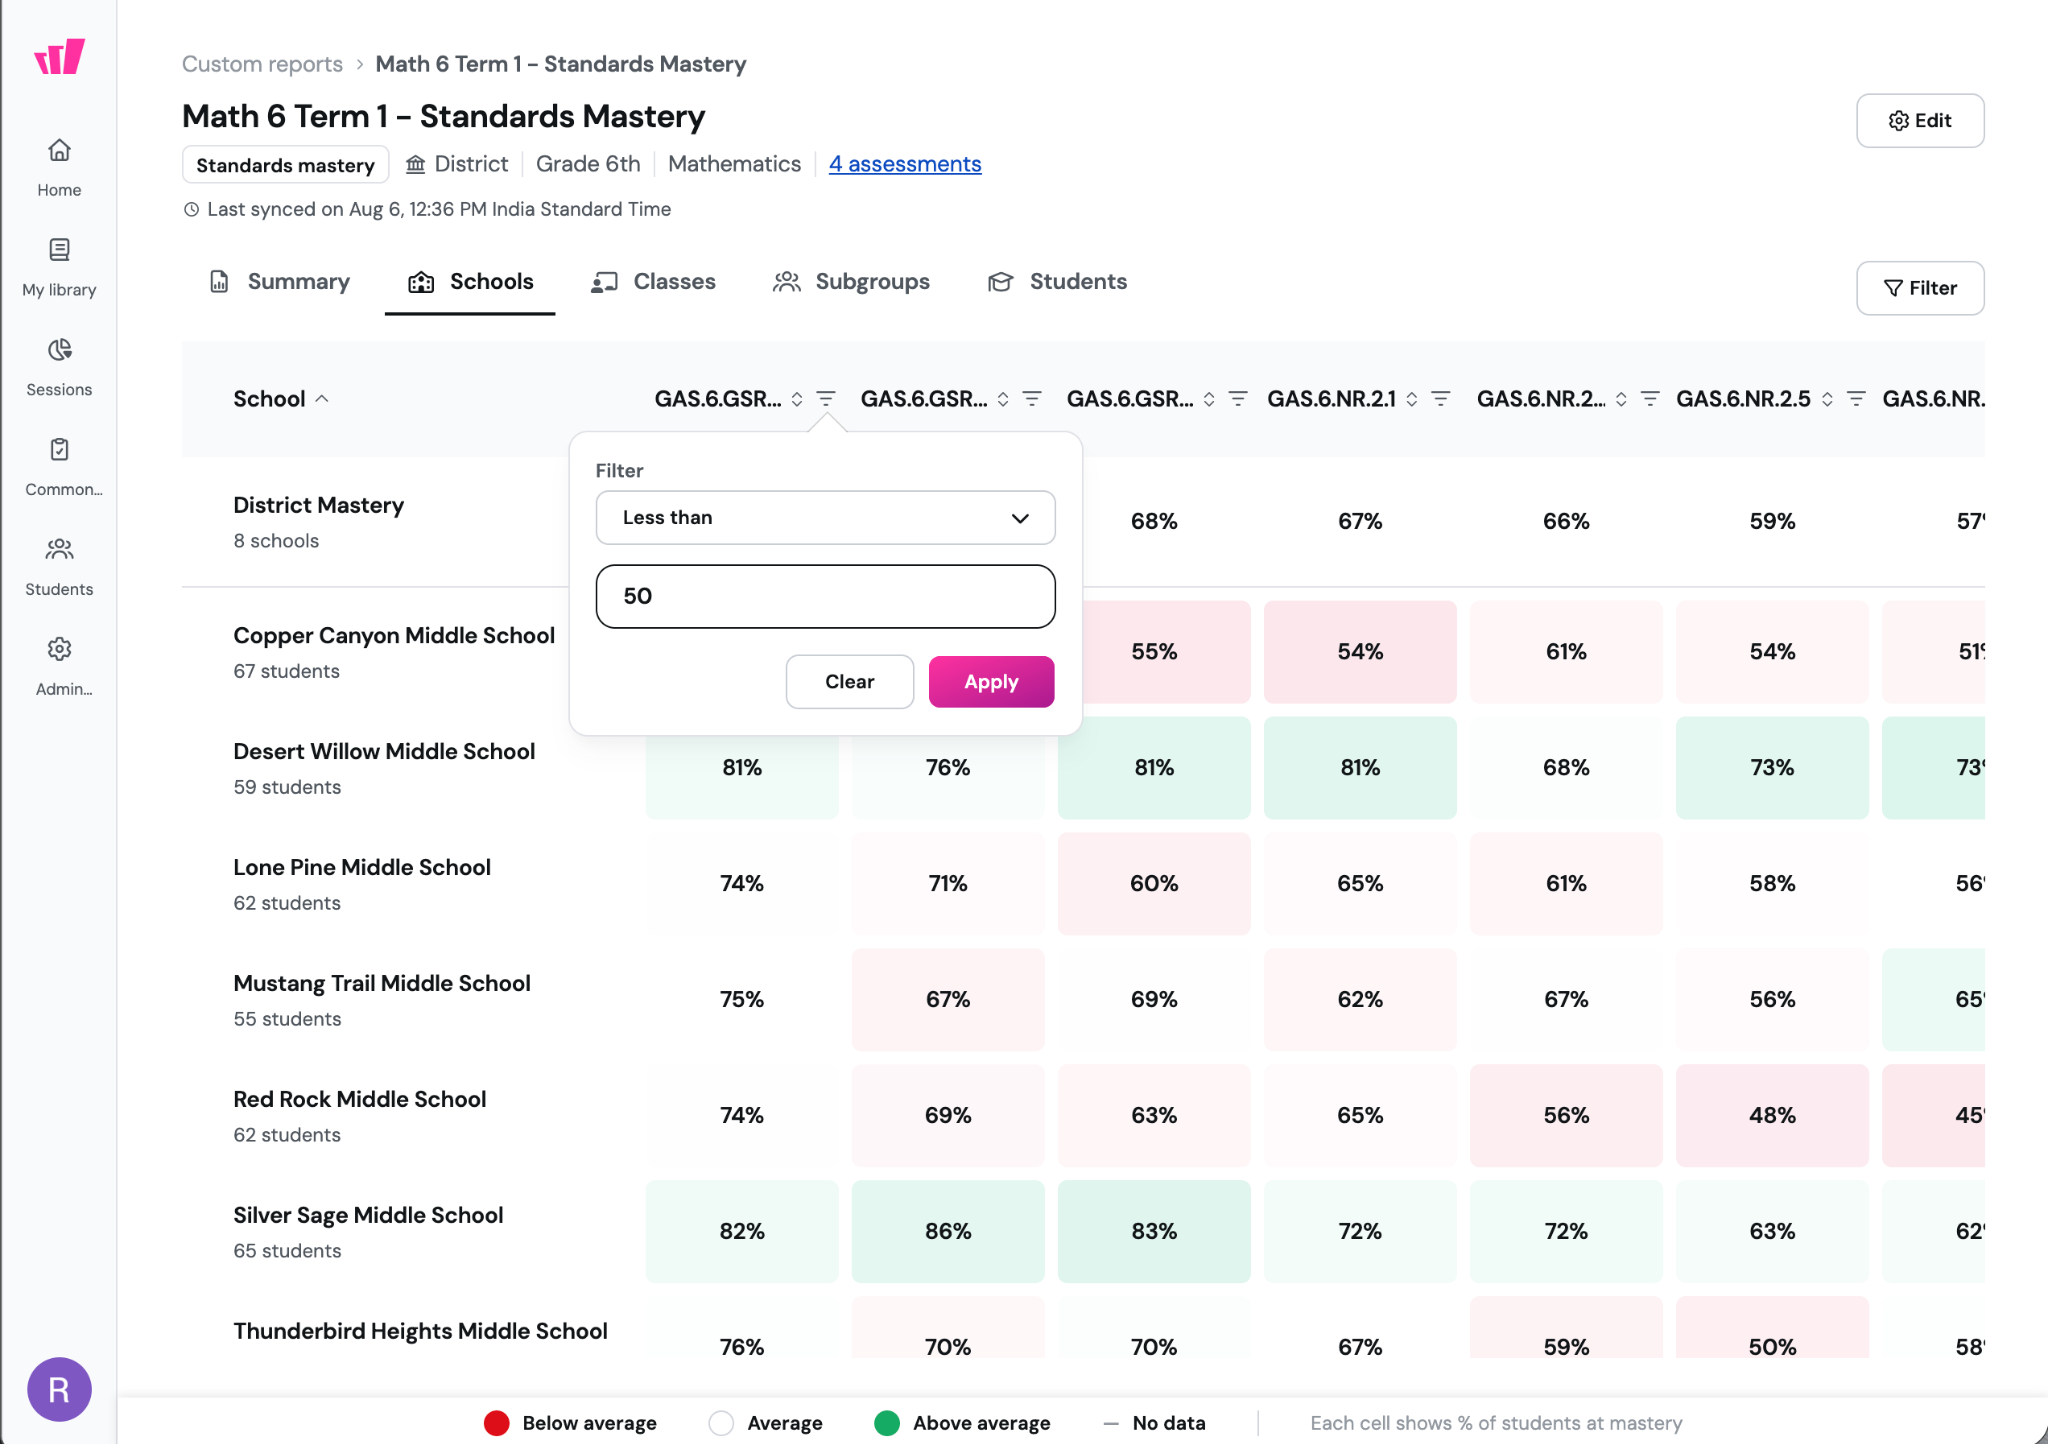
The Schools, Classes, and Subgroups tabs present a two-dimensional heatmap, with the selected groups in rows and standards in columns. Read across a row to see one group’s pattern across standards, or scan down a column to compare groups on one standard. Sort or filter the heatmap by mastery to bring the most relevant groups or standards into view.
Schools
Compare schools to identify districtwide strengths, shared needs, and school-specific patterns. Read across a school’s row to see its results across standards; scan down a standard’s column to compare that standard across schools. Sort or filter the heatmap by mastery to focus on the range you want to examine.
You can use stronger results to identify schools whose approaches or resources could inform others. For weaker or uneven results, you can decide whether coordinated or school-specific support is needed. Click any cell to continue to its class, subgroup, and student results.
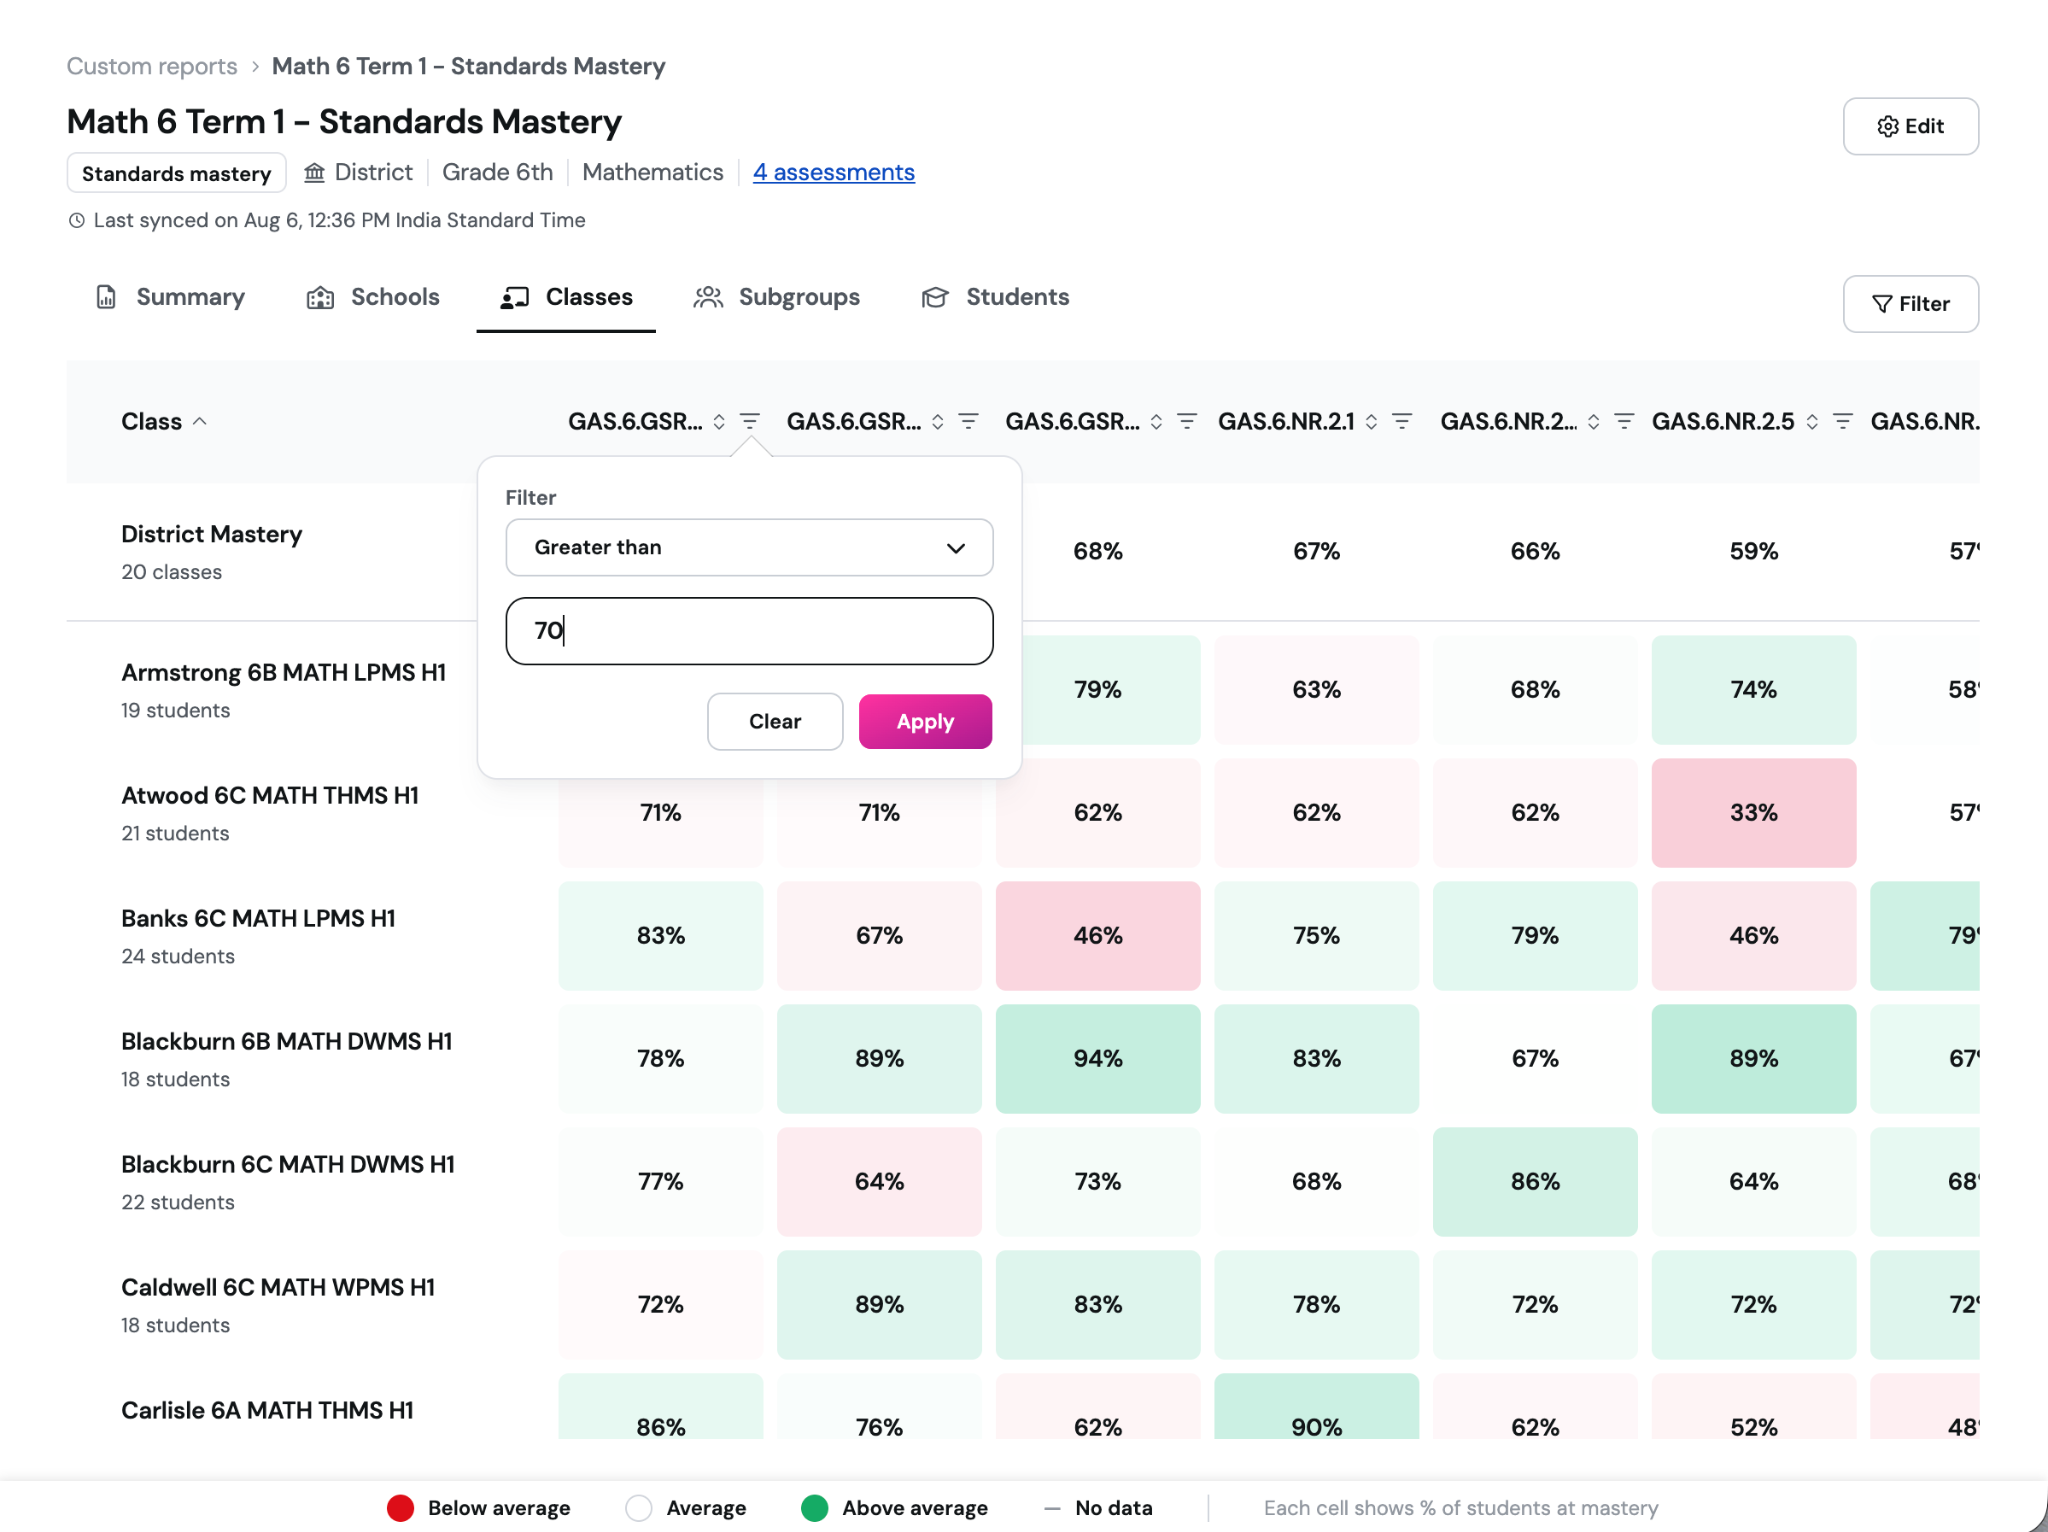
Classes
Compare classes to identify shared strengths and where targeted support may have the greatest impact. Read across a class’s row to see its results across standards; scan down a standard’s column to compare that standard across classes. Sort or filter the heatmap by mastery to focus on the range you want to examine.
Stronger results can surface practices or resources worth discussing across the instructional team. For weaker or uneven results, you can decide what support would be most useful. Click any cell to continue to its subgroup and student results.
Subgroups
Compare subgroups to identify strengths and patterns that may warrant a closer look. Read across a subgroup’s row to see its results across standards; scan down a standard’s column to compare that standard across subgroups. Sort or filter the heatmap by mastery to focus on the range you want to examine.
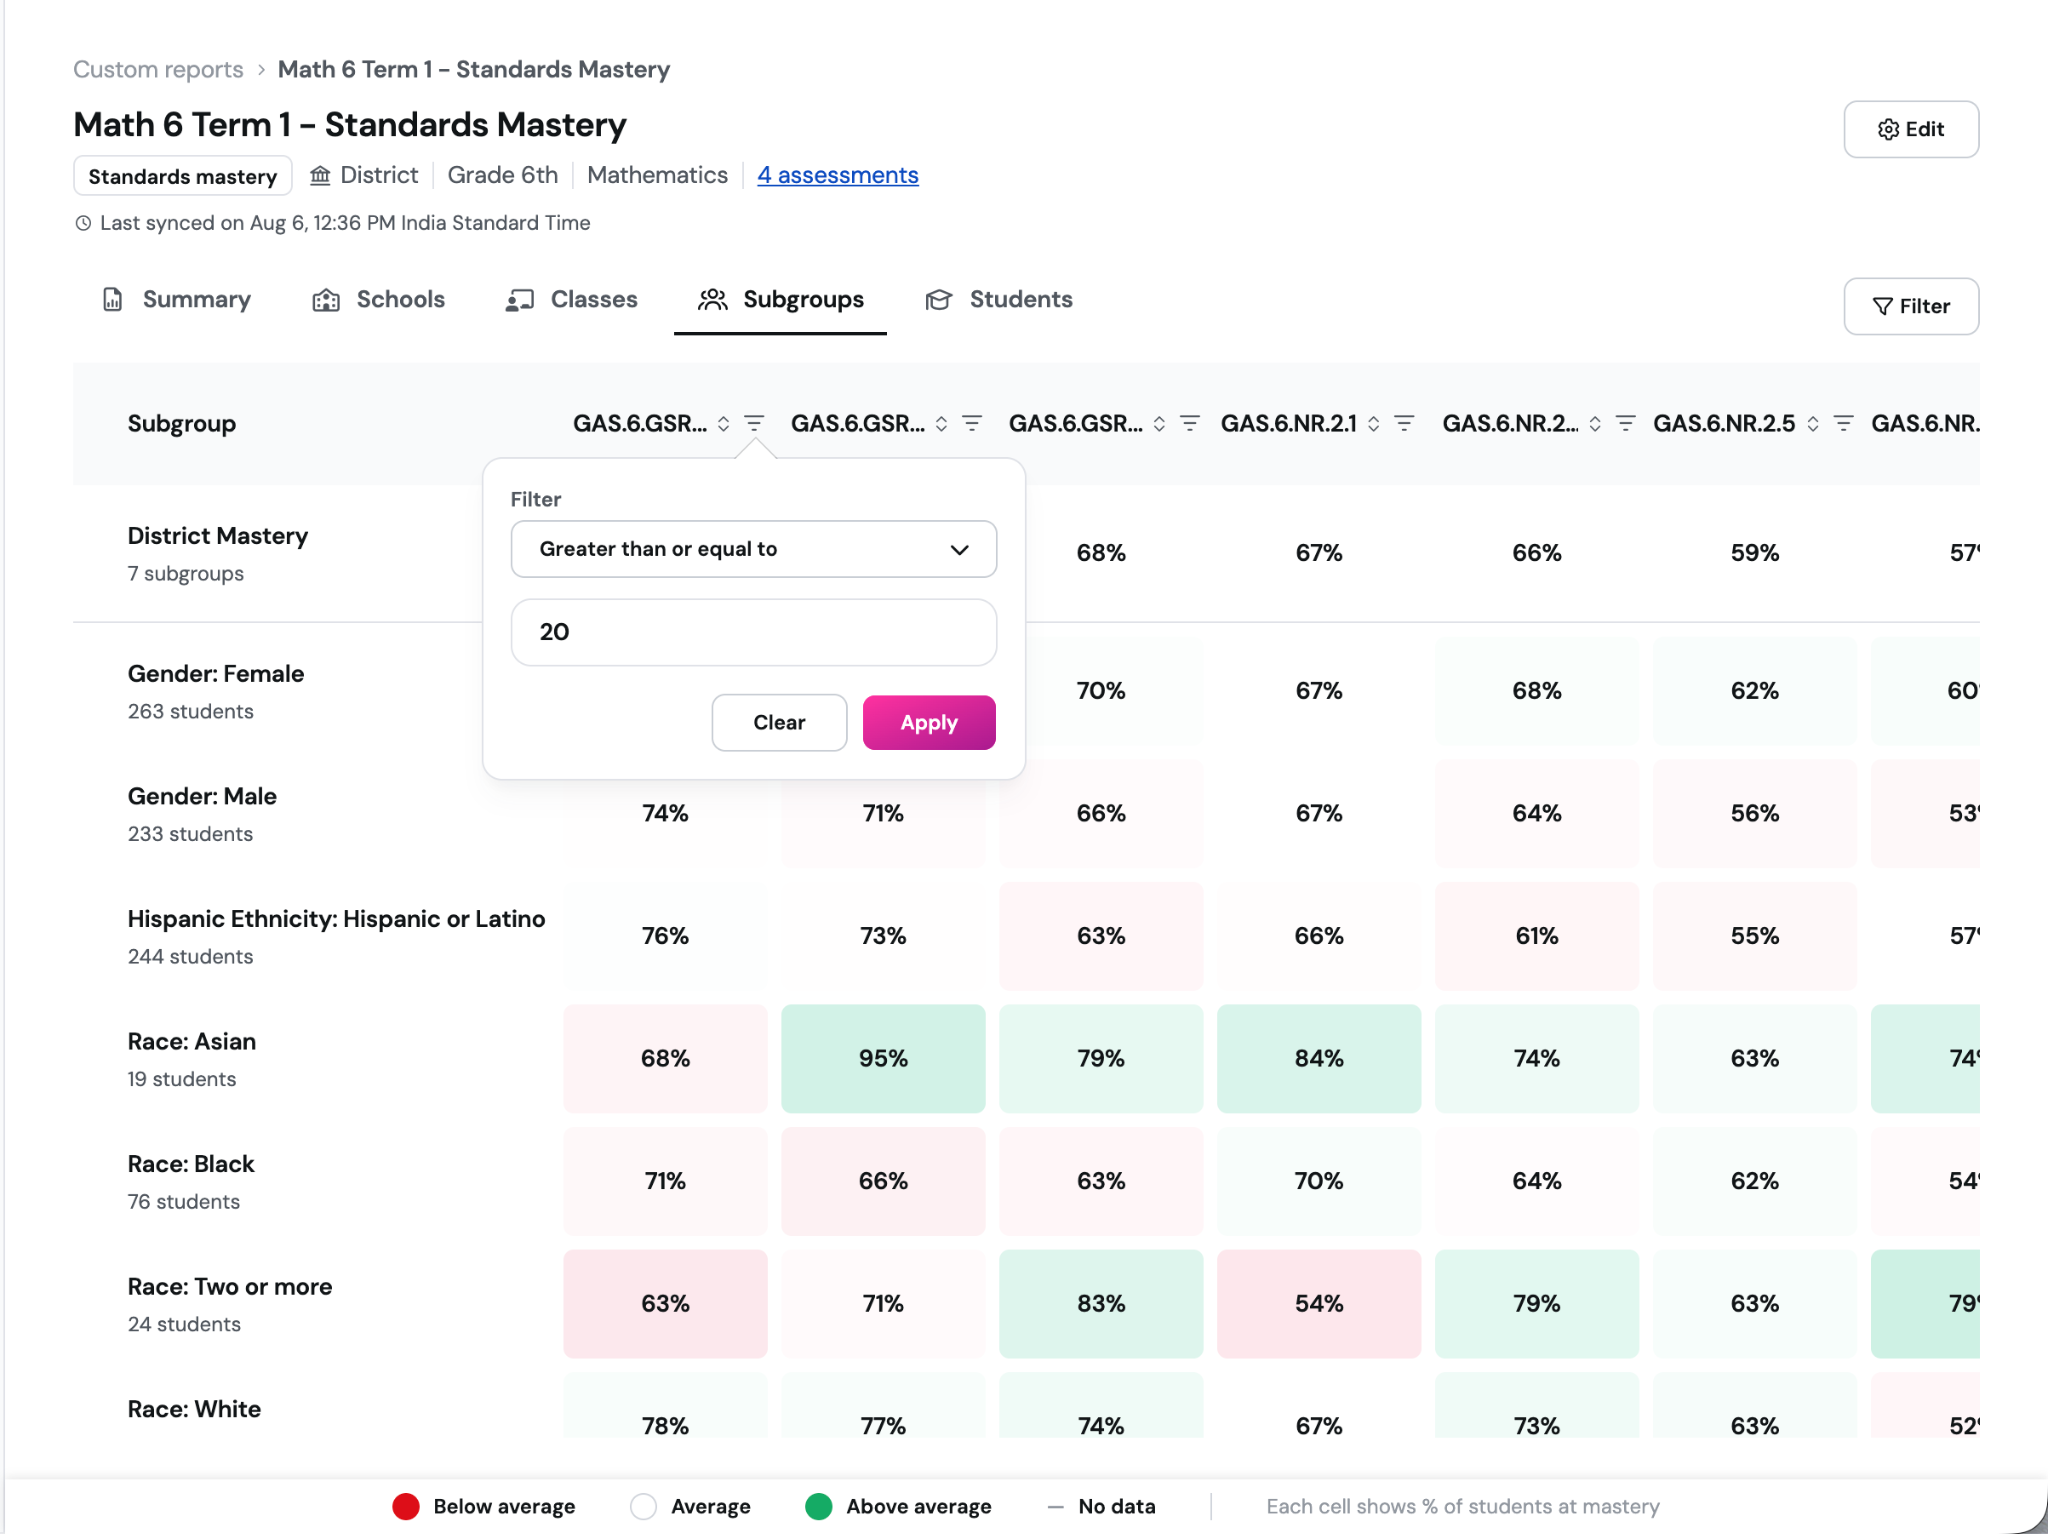
Note: Subgroups are available only if your district has connected Clever or ClassLink to Wayground and configured subgroups. Contact your Wayground Customer Success partner to enable this option.
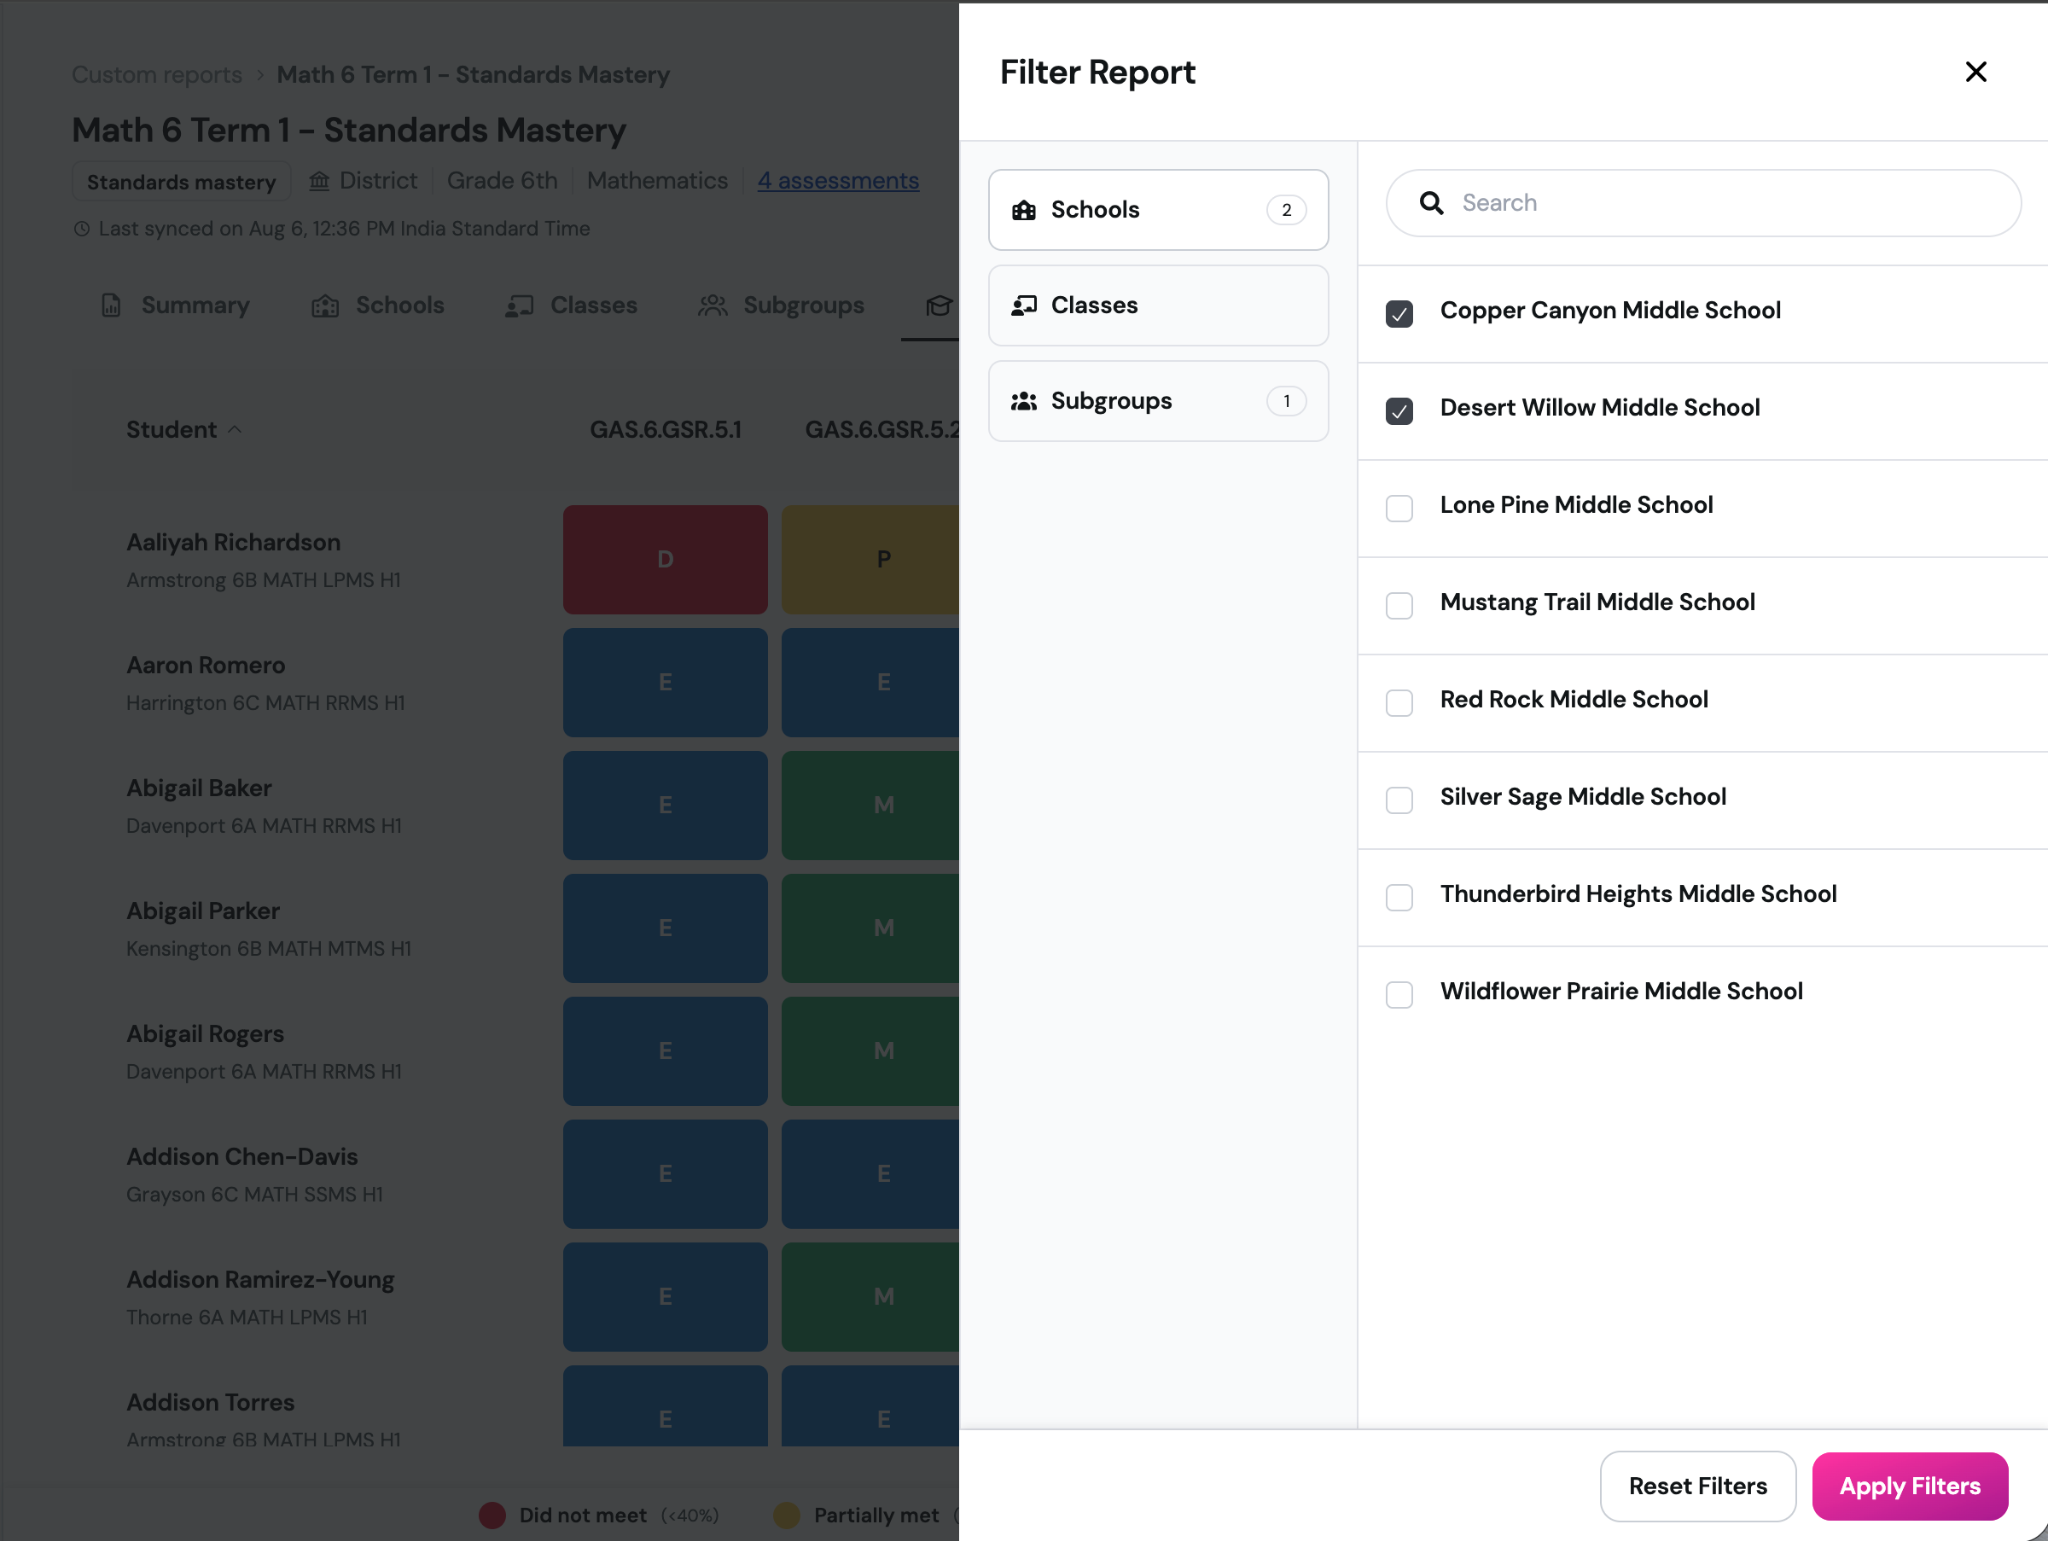
How can I focus every report view on one school, class, or subgroup?
Use the Filter button in the upper-right corner of any report view to narrow results by school, class, or subgroup. Apply a filter when you want every tab to reflect the same population, then clear it to return to the full report.
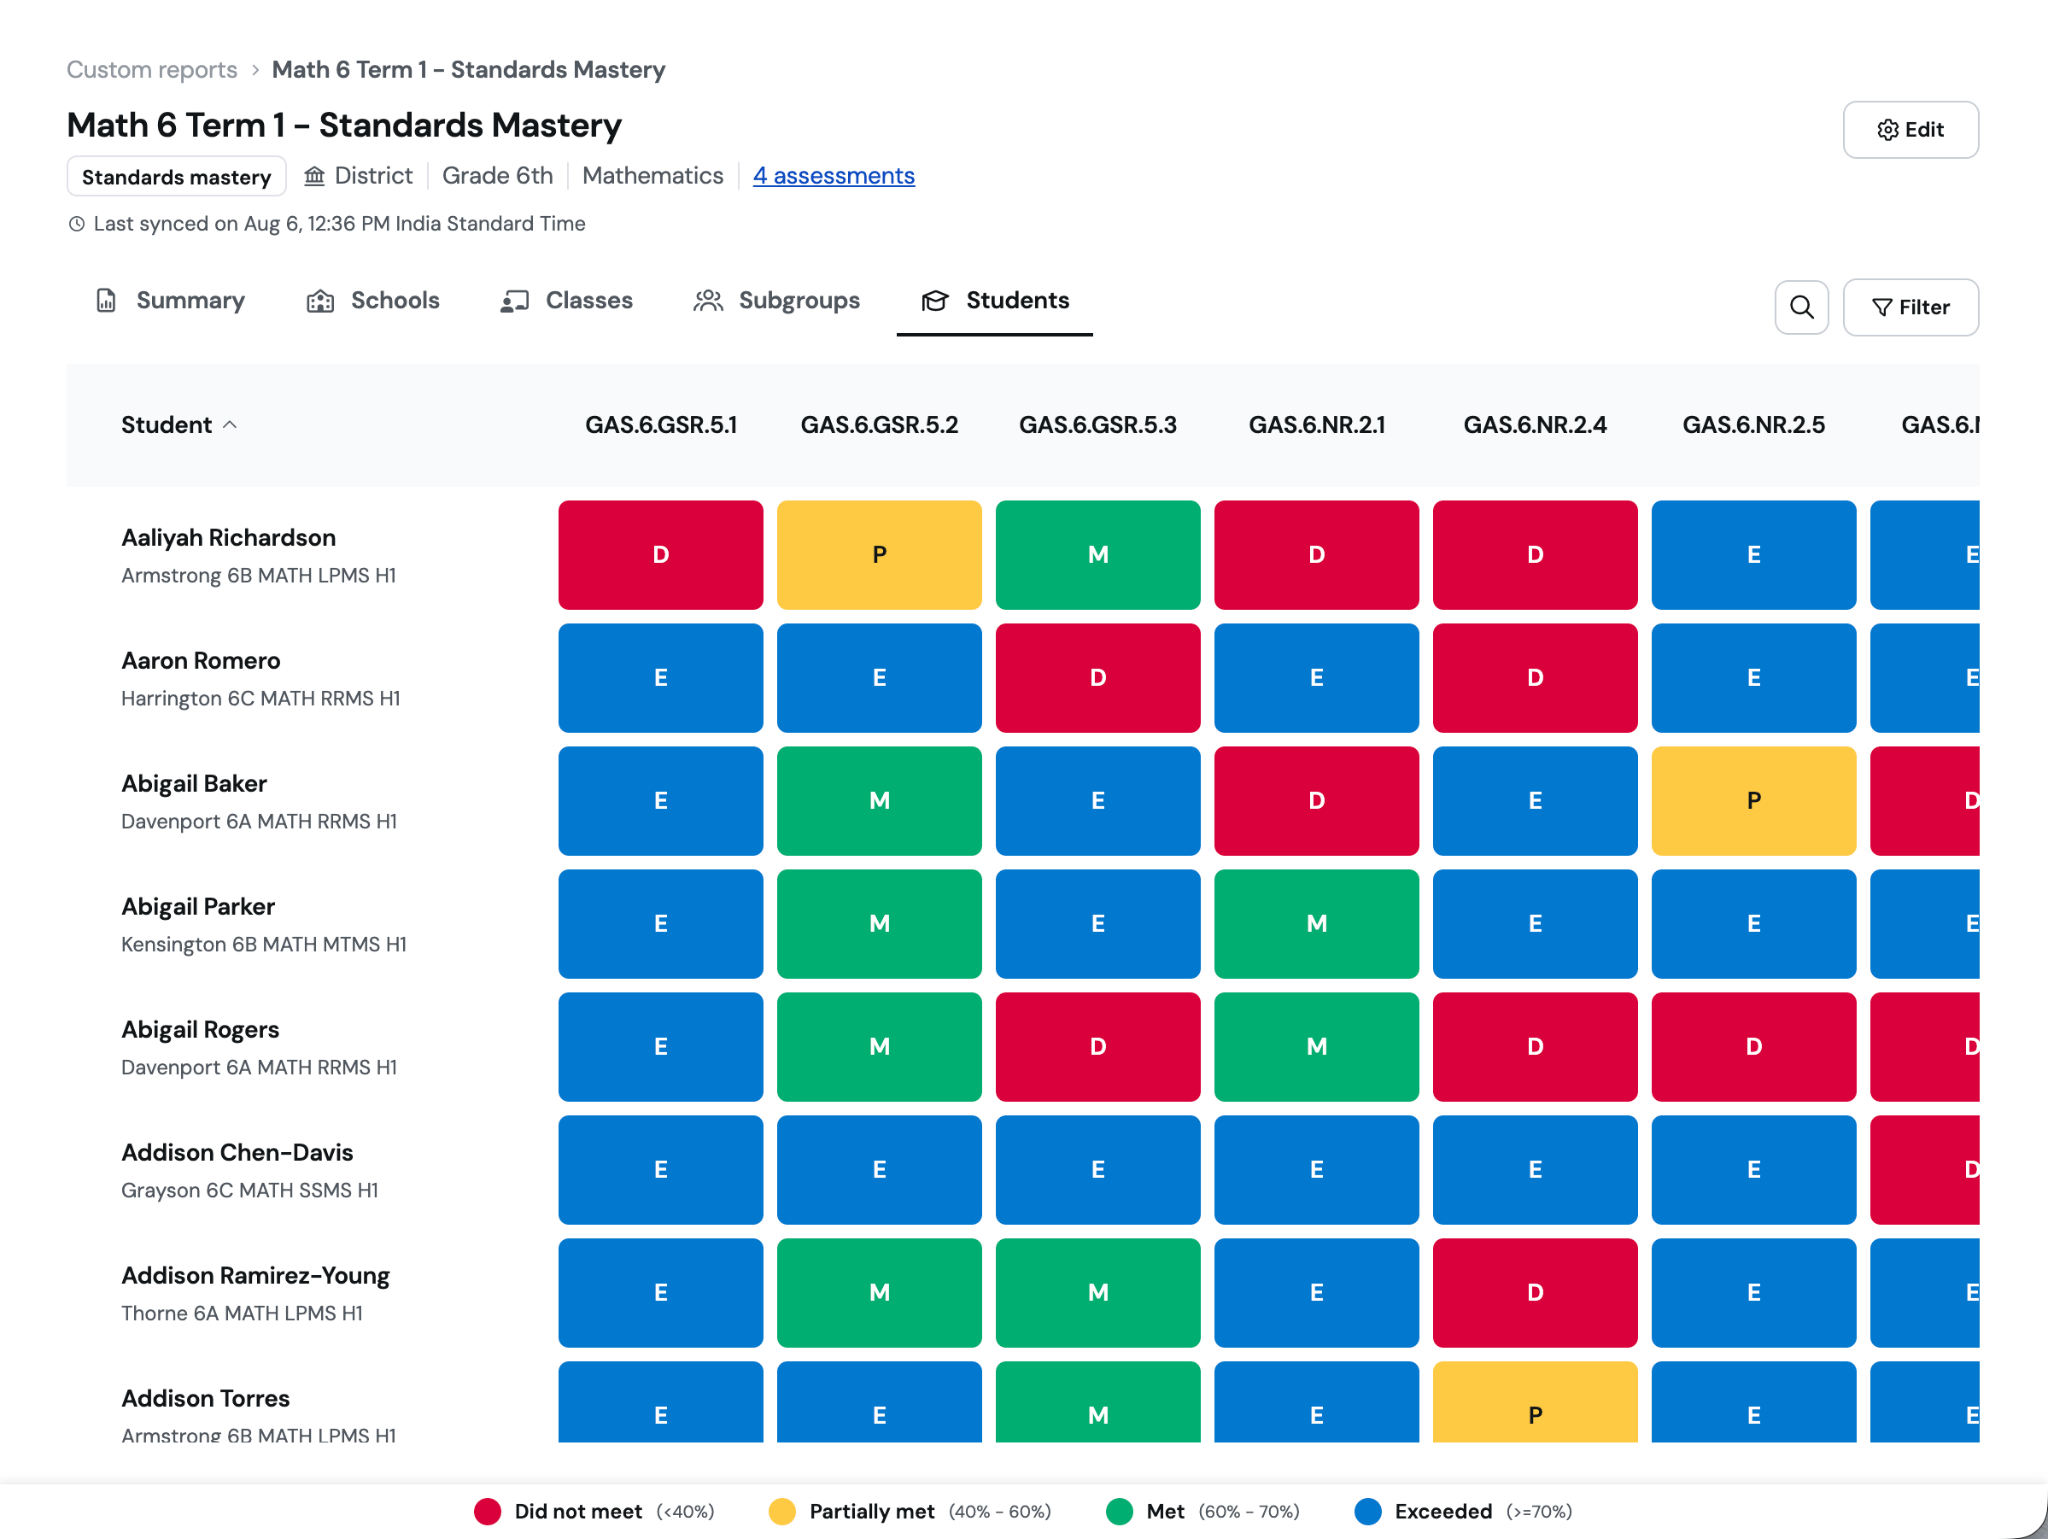
How can I review students’ performance across standards?
Use the Student × Standard view to see students’ performance across the standards in the report.
How has an individual student’s performance on a standard changed across assessments?
In Student × Standard, click any cell to open the assessments in which that standard was measured for the student. Review the results in date order and interpret them alongside recent student work to decide whether to reinforce the current approach, adjust support, or offer a new challenge.
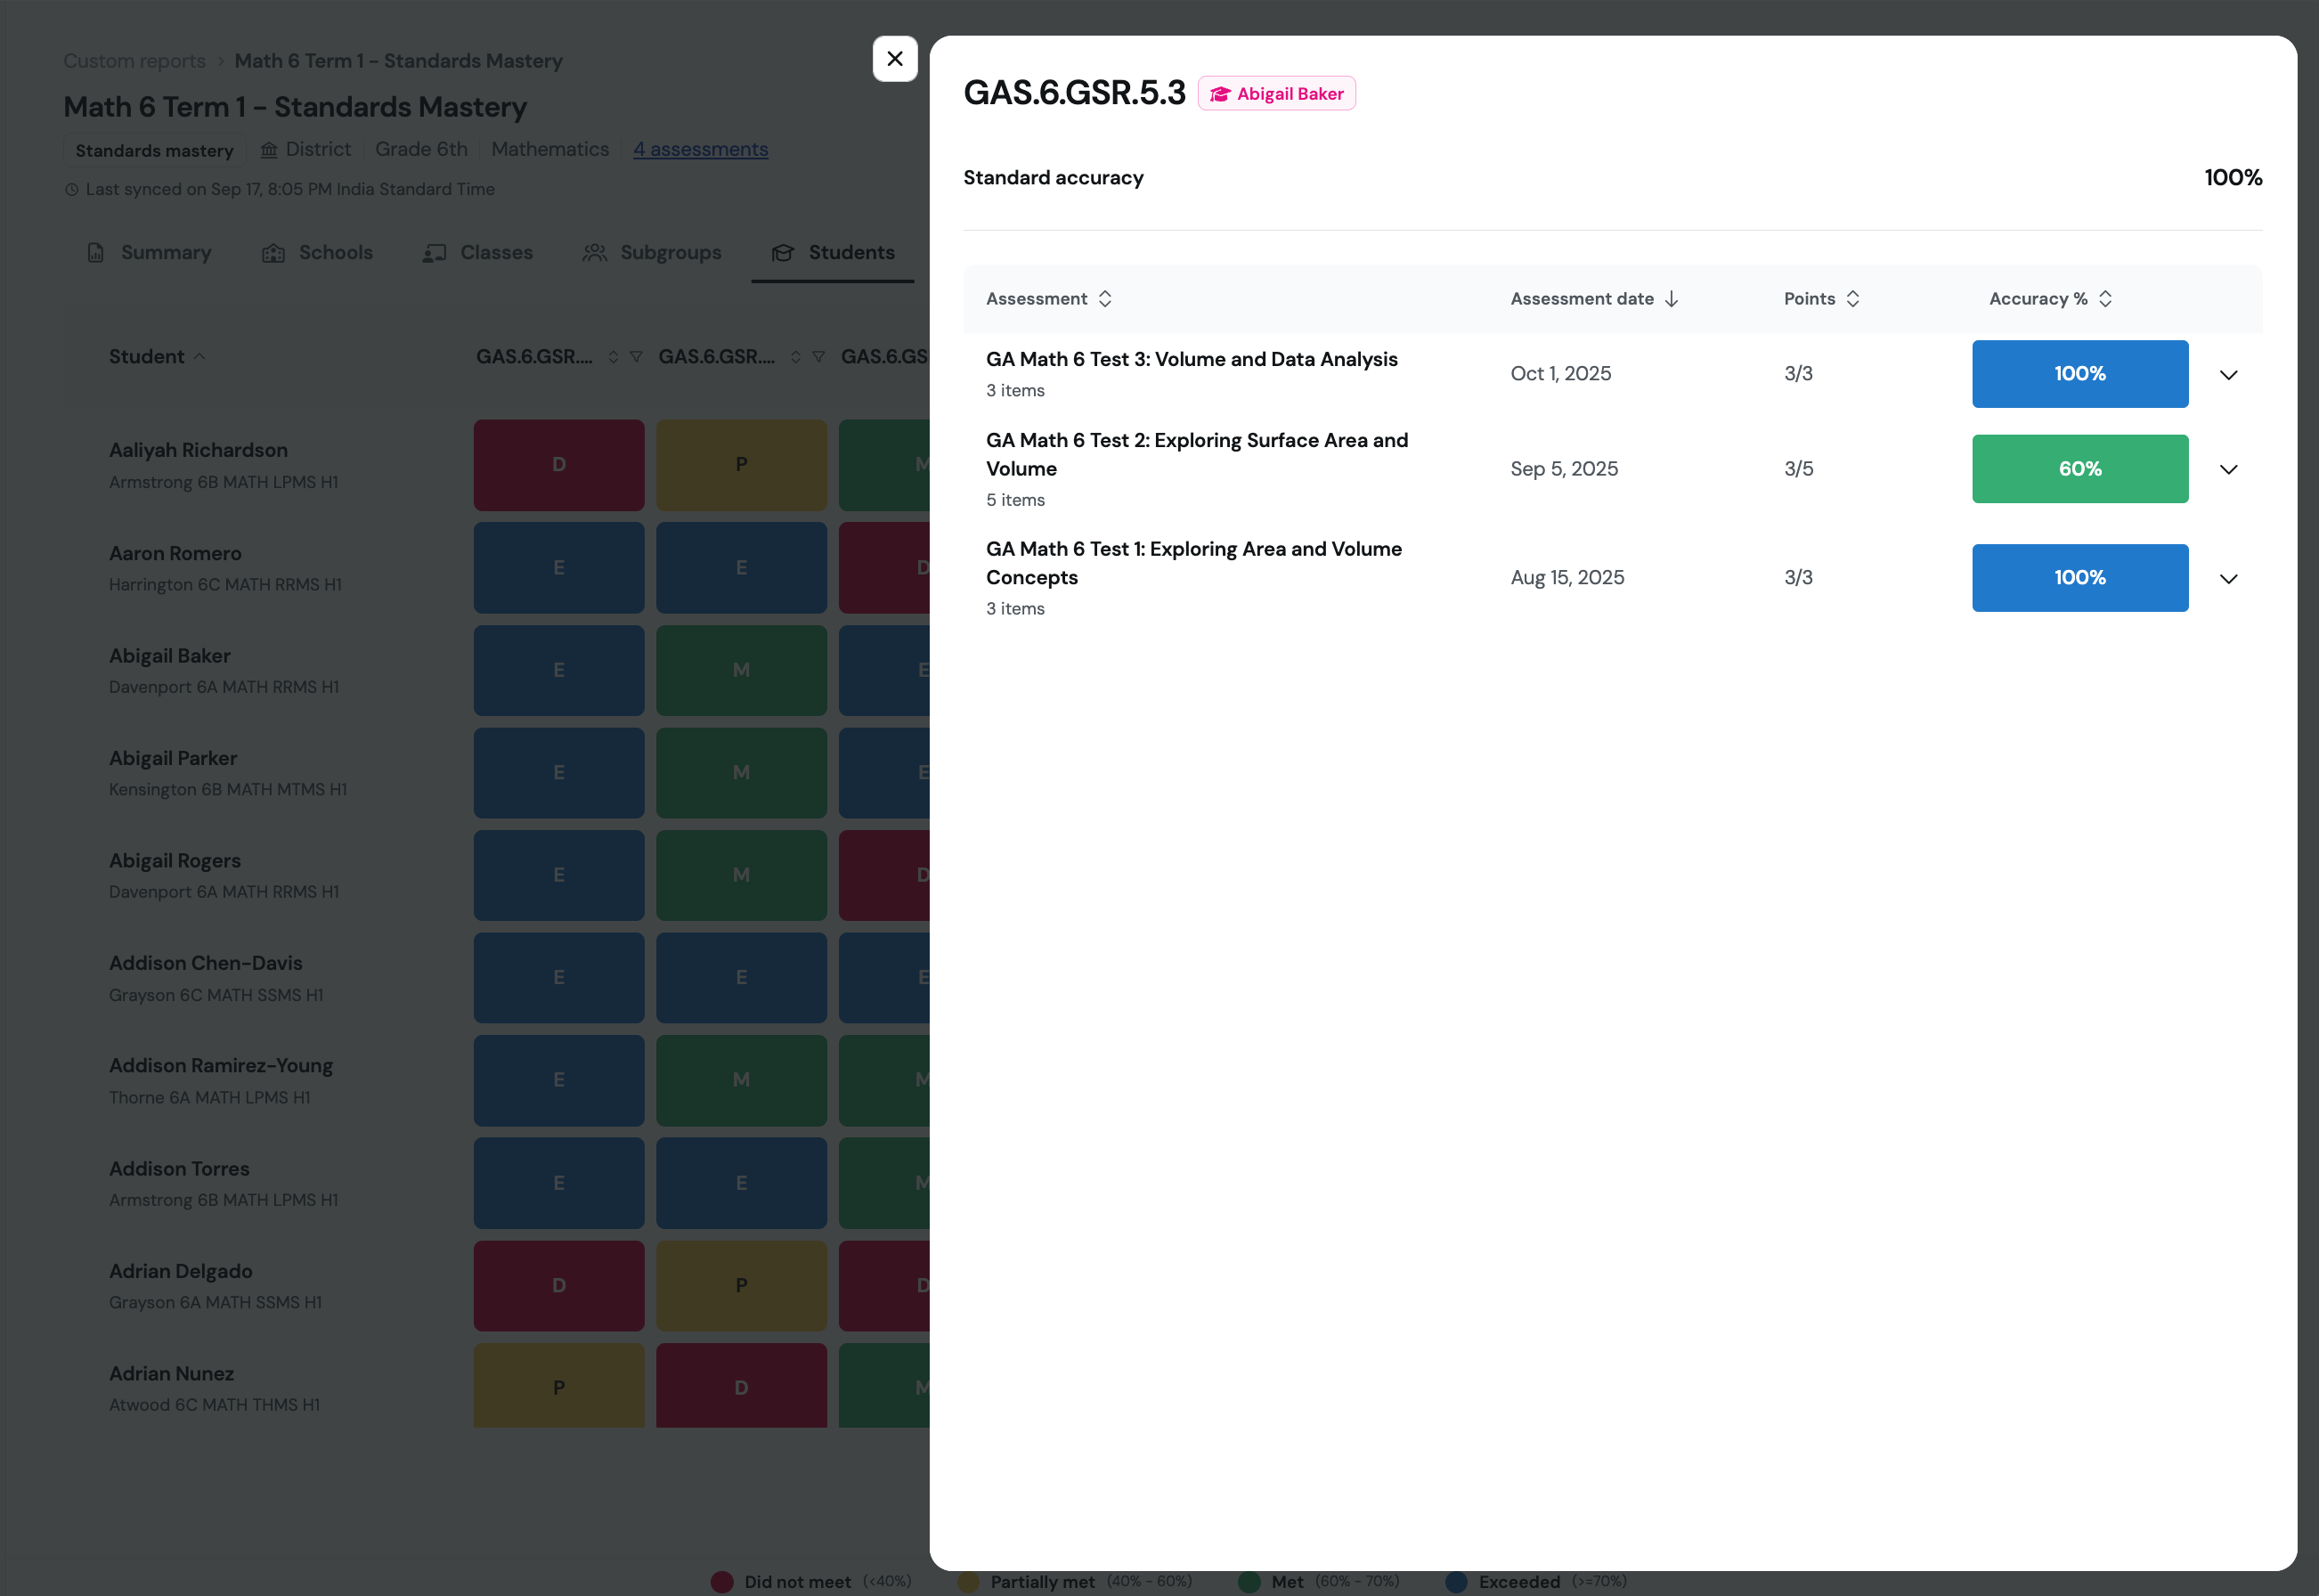
Click on any assessment to reveal the item analysis.
Was this article helpful?
That’s Great!
Thank you for your feedback
Sorry! We couldn't be helpful
Thank you for your feedback
Feedback sent
We appreciate your effort and will try to fix the article